A set represents a collection of distinct objects considered as an entity.
Venn Diagrams are visual representations of distinct mathematical sets and their relationships. They are also widely used in other fields to illustrate the logical relationships between sets.
A Venn diagram consists of overlapping and non-overlapping circles (or sometimes other closed shapes like squares) representing the relation between sets. The overlapping parts denote the elements common to the sets, and the non-overlapping part contains elements distinct to a particular set.
With Two Sets
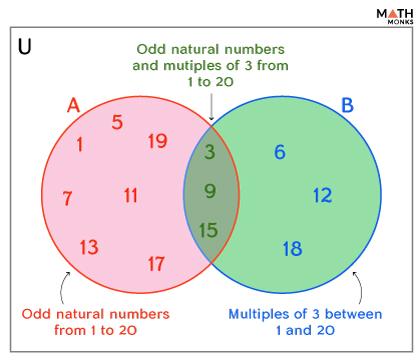
If A = {odd natural numbers from 1 to 20} and B = {multiples of 3 between 1 and 20}
Representing them on a Venn diagram, we get
In the above Venn diagram, the rectangular box represents the universal set, which has two overlapping circles representing sets A = {1, 3, 5, 7, 9, 11, 13, 15, 17, 19} and B = {3, 6, 9, 12, 15, 18}
The overlapping part of the circles contains elements common to both sets, A ∩ B = {3, 9, 15}
For Subsets
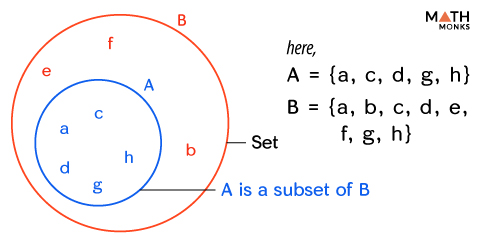
In a Venn diagram, a subset is depicted by drawing a circle or another shape inside the larger circle or shape that represents the larger set.
If A = {a, c, d, g, h} and B = {a, b, c, d, e, f, g, h}, A is a subset of B, and B is the bigger set.
Constructing a Venn diagram with the above sets, we get:
Here is the formula used to solve problems involving two sets:
n(A ∪ B) = n(A) + n(B) – n (A ∩ B)
With Three Sets
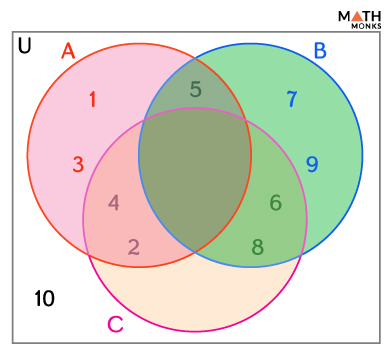
Similar to representing 2 sets, a Venn diagram can also be constructed involving three sets.
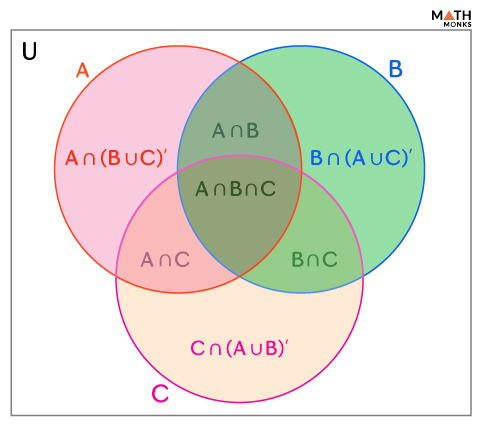
Here,
- A ∩ B = the elements common to both sets A and B.
- B ∩ C = the elements common to both sets B and C.
- A ∩ C = the elements common to both sets A and C.
- A ∩ (B ∪ C)’ = the set of elements in A but not in B or C.
- B ∩ (A ∪ C)’ = the set of elements in B but not in A or C.
- C ∩ (A ∪ B)’ = the set of elements in C but not in A or B.
- A ∩ B ∩ C = the elements common to sets A, B, and C.
Here is the formula used to solve problems involving three sets:
n (A ∪ B ∪ C) = n(A) + n(B) + n(C) – n(A ∩ B) – n(B ∩ C) – n(C ∩ A) + n(A ∩ B ∩ C)
With Four Sets
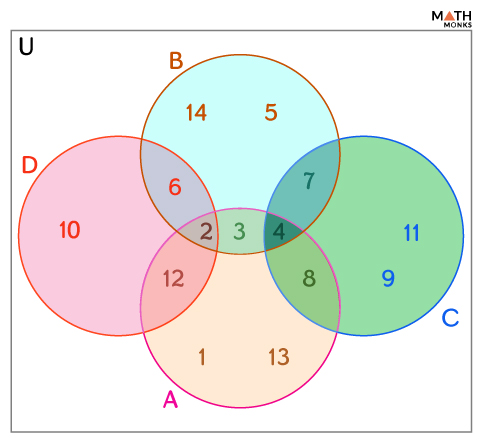
Venn diagrams can have unlimited circles.
If A = {1, 2, 3, 4, 8, 12, 13}, B = {2, 3, 4, 5, 6, 7, 14}, C = {4, 7, 8, 9, 11}, and D = {2, 6, 10, 12}, the Venn diagram can be formed by involving these four sets, as shown.
Constructing
To draw a Venn diagram, we start with the universal set U, which contains all other sets as subsets, and then draw all the circles, where each circle represents a different set. Thus, every set will be within the universal set. If some elements are common to both sets, we place them within the intersecting circles.
Let us construct a Venn diagram to represent sets A = {1, 2, 3, 4, 5}, B = {5, 6, 7, 8, 9}, C = {2, 4, 6, 8}, and U = {set of natural numbers}.
First, the rectangle is formed with the universal set, U = {1, 2, 3, 4, 5, 6, 7, 8, 9, 10}, then three overlapping circles are drawn within it representing sets A, B, and C.
Here,
A ∩ B = {5}
B ∩ C = {6, 8}
A ∩ C = {2, 4}
Constructing a Venn diagram with the above sets, we get:
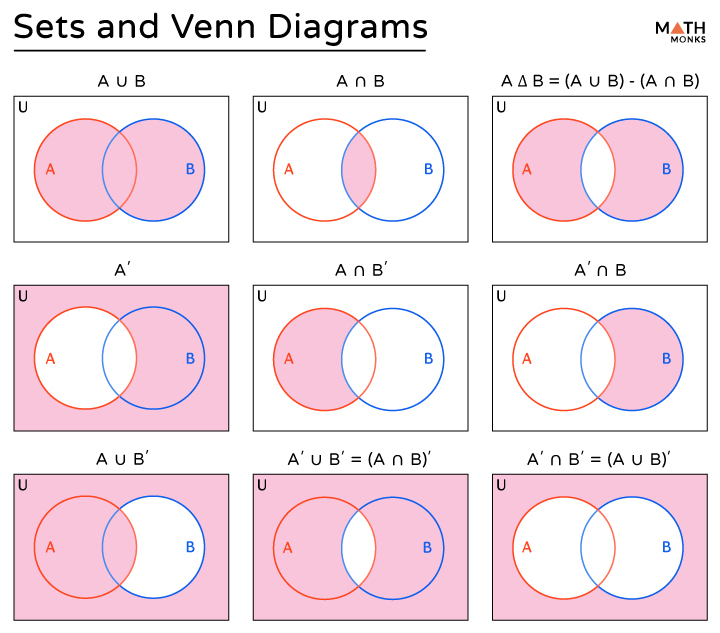
Venn Diagrams of Set Operations
The various set operations are represented in the Venn diagram as follows:
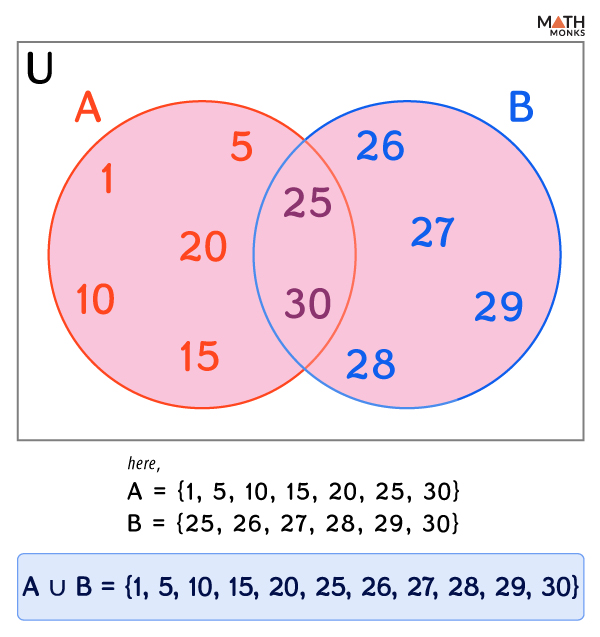
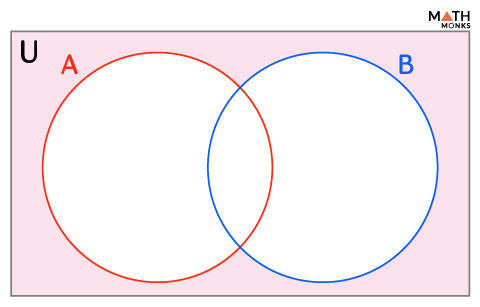
Union (∪)
If A and B are two sets, A union B, denoted by A ∪ B, represents all the combined elements of both sets.
A ∪ B = {x | x ∈ A or x ∈ B}
In the Venn diagram, A ∪ B is shown by the shaded region.
[Upload the diagram with the filename: Union of Sets]
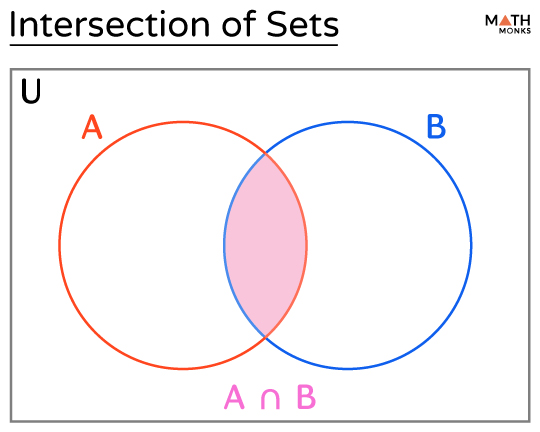
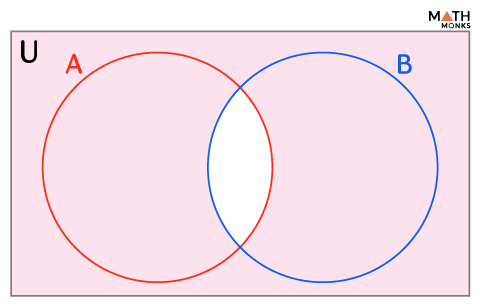
Intersection (∩)
If A and B are two sets, A intersection B, denoted by A ∩ B, represents the common elements of both sets.
A ∩ B = {x | x ∈ A and x ∈ B}
In the Venn diagram, A ∩ B is shown by the shaded region.
[Upload the diagram with the filename: Intersection of Sets]
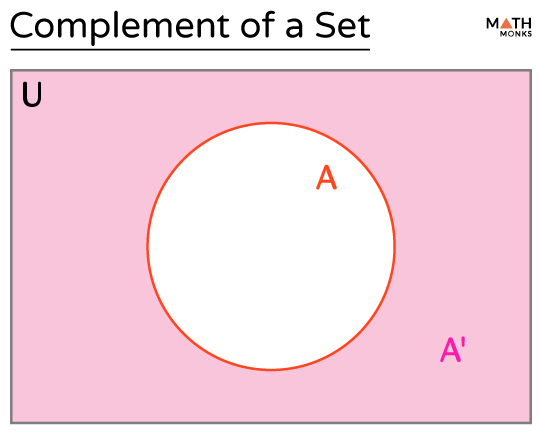
Complement (A’ or Ac)
The complement of a set contains all elements that are in the original set. If A is a set, its complement is denoted by A’ or Ac.
A’ = {x | x ∈ U and x ∉ A}
In the Venn diagram, A’ or Ac is shown by the shaded region.
[Upload the diagram with the filename: Complement of a Set]
Complement of Union (A ∪ B)’
The complement of A union B is a set representing elements neither in set A nor in set B.
Complement of Intersection (A ∩ B)’
The complement of A intersection B is a set representing elements of the universal set that are not common between sets A and B.
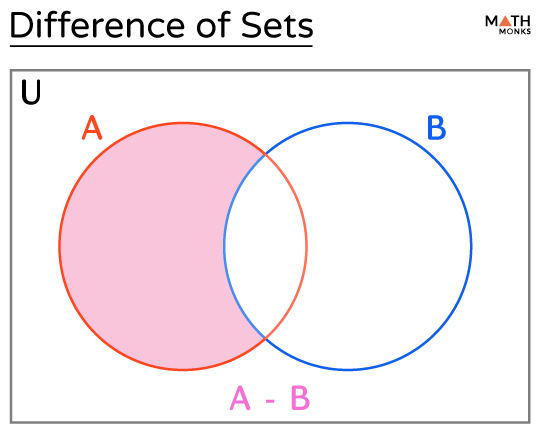
Difference (A – B)
The difference between sets A and B is a set representing elements of set A but not in set B.
[Upload the diagram with the filename: Difference in Sets]
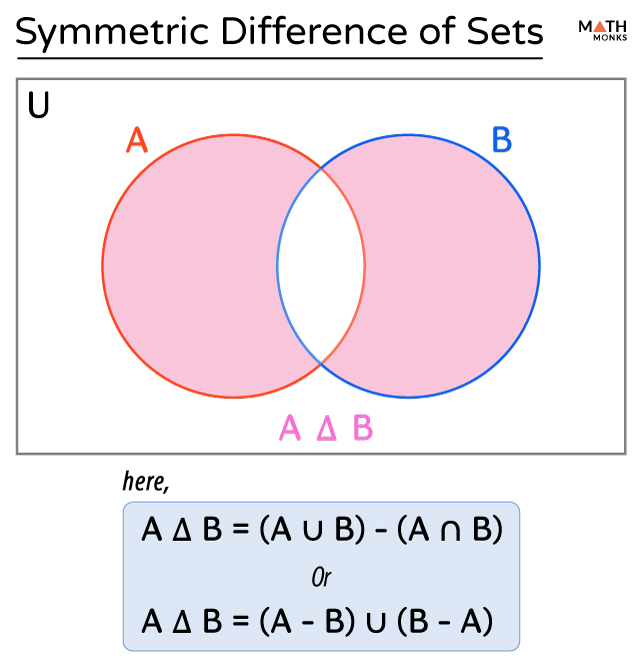
Symmetric Difference (A Δ B)
The symmetric difference of sets A and B is a set consisting of elements in either sets A or B but not in both.
Here is a summary of the commonly used set operations with their Venn diagrams:
Formulas
Solved Examples
![]() In a class of 70 students, 15 play football, 25 play cricket, and 8 play both. Find the number of students who don’t play either football or cricket.
In a class of 70 students, 15 play football, 25 play cricket, and 8 play both. Find the number of students who don’t play either football or cricket.
Solution:
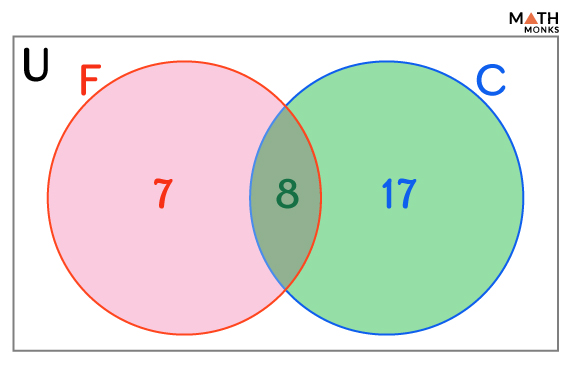
Here, n(F) = 15
n(C) = 25
n(F ∩ C) = 8
Now, n(F ∪ C) = n(F) + n(C) – n(F ∩ C) = 15 + 25 – 8 = 32
Thus, the number of students who don’t play either football or cricket = 70 – n(F ∪ C) = 70 – 32 = 38.
![]() Out of 150 students in a school, 63% passed in Mathematics, 52% in Science, and 47% in both. What is the percentage of students who only passed in Science?
Out of 150 students in a school, 63% passed in Mathematics, 52% in Science, and 47% in both. What is the percentage of students who only passed in Science?
Solution:
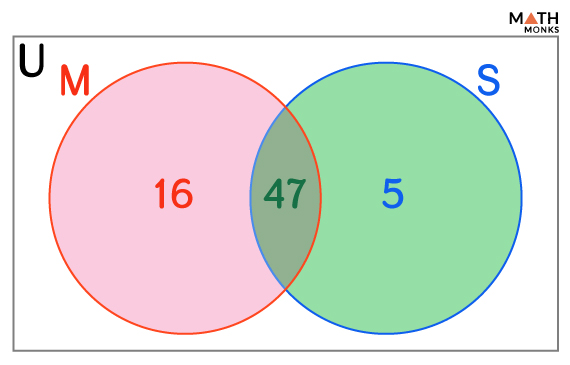
Here, n(M) = 63
n(S) = 52
n(M ∩ S) = 47
Thus, the percentage of students who only pass in Science = n(S) – n(M ∩ S) = 52 – 47 = 5%