Last modified on October 9th, 2024

chapter outline


Graphing Parabolas

To graph a parabola, we first need to know its equation, which in the standard form is written as y = ax2 + bx + c 

here,  

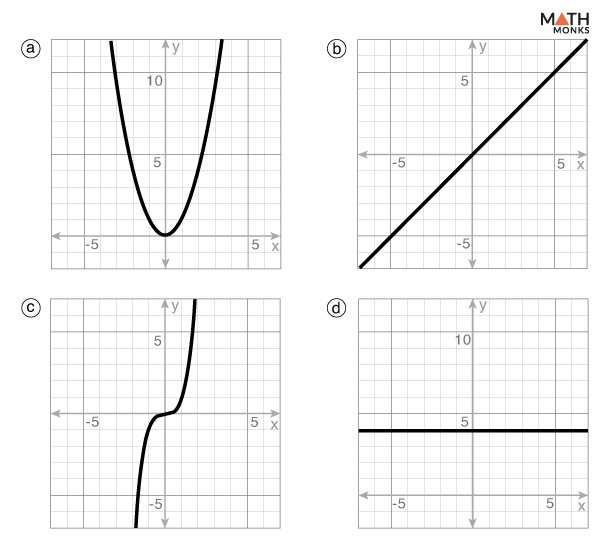
  • a determines the width and the direction of the parabola
  • b affects the position of the vertex (the peak or the lowest point)
  • c represents the y-intercept of the parabola
  • x is the independent variable, and y is the dependent variable

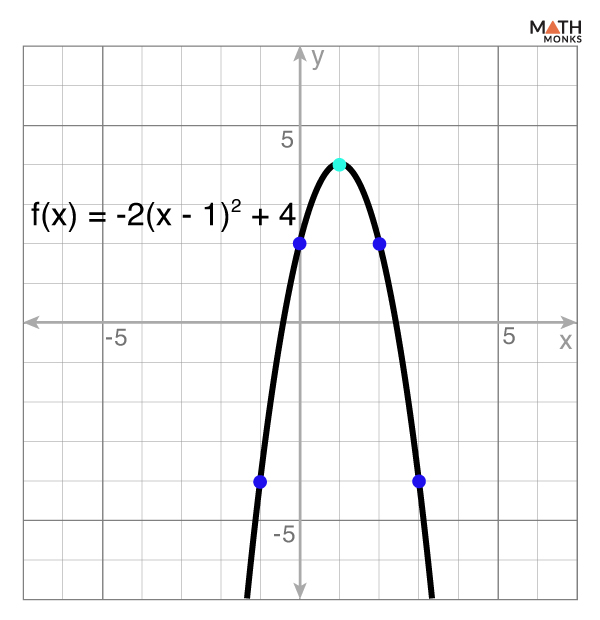
However, the form of the equation can vary depending on whether the vertex is at the origin (0, 0) or any other point, say (h, k). 

To graph a parabola, we need the following:

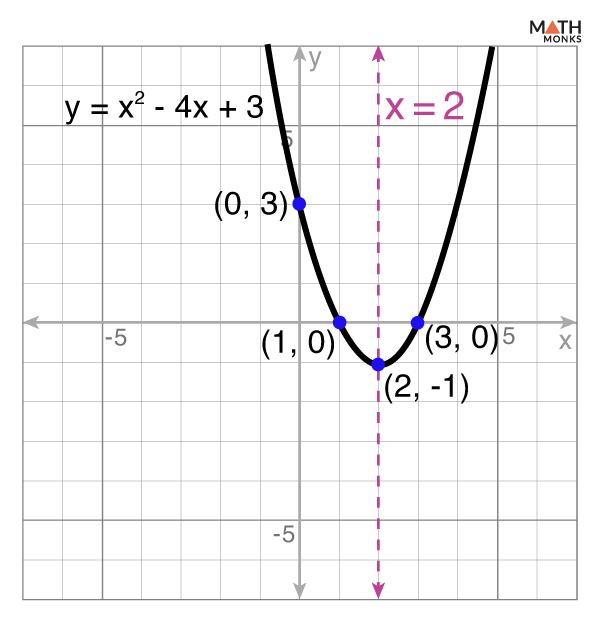
  • y-intercept: This is the point where the parabola crosses the y-axis. It occurs when x = 0, and its value is c
  • x-intercepts (Roots): These are the points where the parabola crosses the x-axis. They can be found by solving the quadratic equation y = ax2 + bx + c
  • Vertex: It is the highest or lowest point on the parabola, depending on its direction. If the parabola opens upward, the vertex is the minimum point; if it opens downward, it’s the maximum point.
  • Axis of Symmetry: This is a vertical line that passes through the vertex, dividing the parabola into two equal halves. Based on the axis of symmetry, a parabola can be horizontal or vertical. The equation for the axis of symmetry can be found using x = -b/2a

Steps

To graph a parabola, we first check whether the given equation is in standard form. If it is in standard form, we will proceed to step 1. If not, then we will first rewrite it in the standard form before following the given steps.  

  1. Finding y and x-intercepts
  2. Determining the coordinates of the Vertex
  3. Creating a Function Table and Finding Two Points on Each Side of the Vertex
  4. Plotting the Points and Sketching the Parabola

Let us graph the parabola f(x) = 2x2 – 6x + 4 …..(i)

Finding x and y Intercepts 

Here, the parabola is already in its standard form.

Comparing the given equation with the standard form y = ax2 + bx + c, we get

a = 2, b = -6, c = 4

Finding y-intercept:

Setting x = 0, we get

y = f(x) = 2(0)2 – 6(0) + 4 = 4

Thus, the y-intercept is (0, 4)

Finding x-intercept:

Setting y = 0, we get

2x2 – 6x + 4 = 0

⇒ ${x=\dfrac{-b\pm \sqrt{b^{2}-4ac}}{2a}}$

⇒ ${x=\dfrac{-\left( -6\right) \pm \sqrt{\left( -6\right) ^{2}-4\times 2\times 4}}{2\times 2}}$

⇒ x = 2 and x = 1

Thus, the x-intercepts are (2, 0) and (1, 0)

Determining the coordinates of the Vertex 

The x-coordinate is given by ${h=-\dfrac{b}{2a}}$ 

Substituting the values, we get

h = ${-\dfrac{-6}{2\times 2}}$ 

⇒ h = ${\dfrac{3}{2}}$

⇒ h = 1.5

Now, substituting h into the equation (i), we get

k = f(h) = 2(1.5)2 – 6(1.5) + 4 = -0.5

⇒ k = -0.5

Thus, the vertex is (h, k) = (1.5, -0.5)

Creating a Function Table and Finding Two Points on Either Side of the Vertex 

Now, we will form a function table with two columns (or rows) for the x-coordinate and y-coordinate, containing at least five points on the graph, including the vertex.

Since the vertex represents the ‘turning point’ of the parabola, the coordinates of the vertex will be placed in the middle of the function table. Here, (h, k) = (1.5, -0.5)

Now, we find points on each side of the vertex by choosing x-coordinates that are less than 1.5 and greater than 1.5 and substituting them into the function f(x) to obtain the corresponding f(x) values.

By considering two x-values less than 1.5 and two x-values greater than 1.5, we get

xf(x)
04
10
1.5-0.5
20
34

Here, 

At x = 0, f(0) = 2(0)2 – 6(0) + 4 = 4

At x = 1, f(1) = 2(1)2 – 6(1) + 4 = 0

At x = 2, f(2) = 2(2)2 – 6(2) + 4 = 0

At x = 3, f(3) = 2(3)2 – 6(3) + 4 = 4

Plotting the Points and Sketching the Parabola

Solved Examples

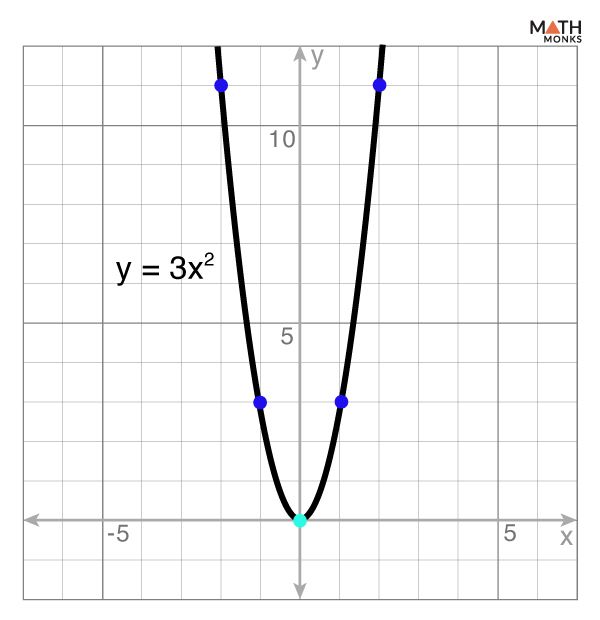
Graph the equation of the parabola y = 3x2

Given y = 3x2, which is in the standard form.

Comparing the given equation with the standard form y = ax2 + bx + c, we get

a = 3, b = 0, c = 0

Now, setting x = 0, we get

y = f(x) = 3(0)2 = 0

Thus, the y-intercept is (0, 0)

Setting y = 0, we get

3x2 = 0

⇒ x = 0 

Thus, the x-intercepts are (0, 0) 

Here, the x-coordinate of the vertex is ${h=-\dfrac{b}{2a}}$ = ${-\dfrac{0}{2\times 3}}$ = ${0}$

⇒ h = 0

By substituting h = 0 in the equation y = 3x2, we get

k = f(h) = 3(0)2 = 0

⇒ k = 0

Thus, the vertex is (h, k) = (0, 0)

Here, the function table is

xf(x)
-212
-13
00
13
212

When plotting the x-values and their corresponding y-values, we get the required graph.

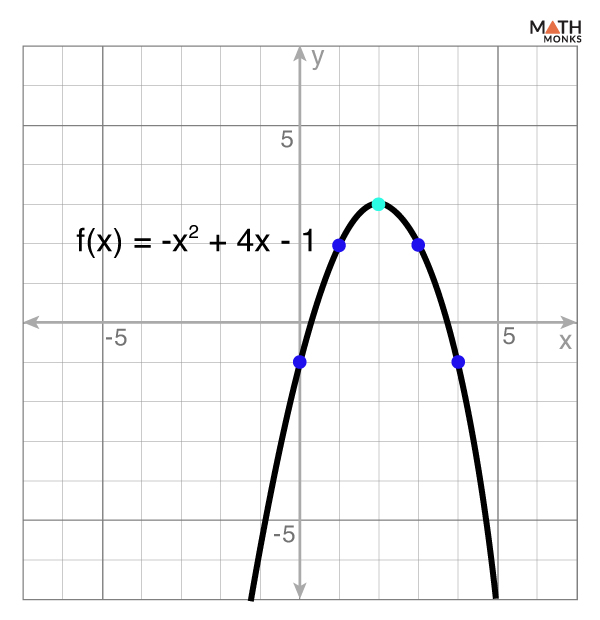
Graph the parabola f(x) = -x2 + 4x – 1

Given f(x) = -x2 + 4x – 1, which is in the standard form.

Comparing the given equation with the standard form y = ax2 + bx + c, we get

a = -1, b = 4, c = -1

Now, putting x = 0, we get

y = f(x) = -(0)2 + 4(0) – 1 = -1

Thus, the y-intercept is (0, -1)

Setting y = 0, we get

-x2 + 4x – 1 = 0

⇒ ${x=\dfrac{-b\pm \sqrt{b^{2}-4ac}}{2a}}$

⇒ ${x=\dfrac{-4\pm \sqrt{4^{2}-4\times \left( -1\right) \times \left( -1\right) }}{2\times \left( -1\right) }}$

⇒ x = ${2+\sqrt{3}}$ and x = ${2-\sqrt{3}}$

Thus, the x-intercepts are ${\left( 2+\sqrt{3},0\right)}$ and ${\left( 2-\sqrt{3},0\right)}$ 

Here, the x-coordinate of the vertex is ${h=-\dfrac{b}{2a}}$ = ${-\dfrac{4}{2\times \left( -1\right) }}$ = ${2}$

⇒ h = 2

By substituting h = 2 in the equation f(x) = -x2 + 4x – 1, we get

k = f(h) = -(2)2 + 4(2) – 1 = 3

⇒ k = 3

Thus, the vertex is (h, k) = (2, 3)

Here, the function table is

xf(x)
0-1
12
23
32
4-1

When plotting the x-values and their corresponding y-values, we get the required graph.

Graph: ${y=\dfrac{1}{2}x^{2}+x-1}$

Given ${y=\dfrac{1}{2}x^{2}+x-1}$

⇒ y = x2 + 2x – 2

Comparing the given equation with the standard form y = ax2 + bx + c, we get

a = 1, b = 2, and c = -2

Now, putting x = 0, we get

y = f(x) = (0)2 + 2(0) – 2 = -2

Thus, the y-intercept is (0, -2)

Putting y = 0, we get

x2 + 2x – 2 = 0

⇒ ${x=\dfrac{-b\pm \sqrt{b^{2}-4ac}}{2a}}$

⇒ ${x=\dfrac{-2\pm \sqrt{2^{2}-4\times 1 \times \left( -2\right) }}{2\times 1}}$

⇒ x = ${-1+\sqrt{3}}$ and x = ${-1-\sqrt{3}}$

Thus, the x-intercepts are ${\left( -1+\sqrt{3},0\right)}$ and ${\left( -1-\sqrt{3},0\right)}$ 

Here, the x-coordinate of the vertex is ${h=-\dfrac{b}{2a}}$ = ${-\dfrac{1}{2\times \dfrac{1}{2}}}$ = ${-1}$

⇒ h = -1

By substituting h = -1 in the equation ${y=\dfrac{1}{2}x^{2}+x-1}$, we get

k = f(h) = ${\dfrac{1}{2}\left( -1\right) ^{2}+\left( -1\right) -1}$

⇒ k = -1.5

Thus, the vertex is (-1, -1.5)

Here, the function table is

xf(x)
-43
-2-1
-1-1.5
0-1
23

When plotting the x-values and their corresponding y-values, we get the required graph.

Graph the parabola f(x) = -2x2 + 4x + 1 

Given f(x) = -2x2 + 4x + 1, which is in the standard form.

Comparing the given equation with the standard form y = ax2 + bx + c, we get

a = -2, b = 4, c = 1

Now, putting x = 0, we get

y = f(x) = -2(0)2 + 4(0) + 1 = 1

Thus, the y-intercept is (0, 1)

Putting y = 0, we get

-2x2 + 4x + 1 = 0

⇒ ${x=\dfrac{-b\pm \sqrt{b^{2}-4ac}}{2a}}$

⇒ ${x=\dfrac{-4\pm \sqrt{4^{2}-4\times \left( -2\right) \times 1}}{2\times \left( -2\right) }}$

⇒ x = ${1+\dfrac{\sqrt{6}}{2}}$ and x = ${1-\dfrac{\sqrt{6}}{2}}$

Thus, the x-intercepts are ${\left( 1+\dfrac{\sqrt{6}}{2},0\right)}$ and ${\left( 1-\dfrac{\sqrt{6}}{2},0\right)}$ 

Here, the x-coordinate of the vertex is ${h=-\dfrac{b}{2a}}$ = ${-\dfrac{4}{2\times \left( -2\right) }}$ = ${1}$

⇒ h = 1

By substituting h = 1 in the equation f(x) = -2x2 + 4x + 1, we get

k = f(h) = -2(1)2 + 4(1) + 1 = 3

⇒ k = 3

Thus, the vertex is (h, k) = (1, 3)

Here, the function table is

xf(x)
-1-5
01
13
21
3-5

When plotting the x-values and their corresponding y-values, we get the required graph.

Graph the parabola with the equation y = x2 – 4x + 3. Find its vertex, axis of symmetry and intercepts.

Given y = x2 – 4x + 3, which is in the standard form.

Comparing the given equation with the standard form y = ax2 + bx + c, we get

a = 1, b = -4, c = 3

Vertex

The x-coordinate of the vertex is ${h=-\dfrac{b}{2a}}$ = ${-\dfrac{-4}{2\times 1}}$ = ${2}$

⇒ h = 2

By substituting h = 2 in the equation y = x2 – 4x + 3, we get

k = (2)2 – 4(2) + 3 = -1

⇒ k = 15

Thus, the vertex is (h, k) = (2, -1)

Axis of Symmetry 

The axis of symmetry is x = 2, which is the vertical line through the vertex.

y-intercept 

Putting x = 0 in the equation y = x2 – 4x + 3, 

y = (0)2 – 4(0) + 3 = 3

Thus, the y-intercept is (0, 3)

x-intercept 

Putting y = 0 in the equation y = x2 – 4x + 3,

0 = x2 – 4x + 3

⇒ (x – 1)(x – 3) = 0

⇒ x = 1 and x = 3

Thus, the x-intercepts are (1, 0) and (3, 0)

Now, plotting the vertex, the axis of symmetry, and the intercepts on a graph, we get the required parabola.

Problem – Graphing a parabola in VERTEX FORM

Graph: y = -2(x – 1)2 + 4 

Given y = -2(x – 1)2 + 4 …..(i)

As we know, the equation of the vertex form of a parabola is y = a(x – h)2 + k …..(ii)

Comparing the equations (i) and (ii), we get

a = -2, h = 1, and k = 4

Putting x = 0, we get

y = -2(0 – 1)2 + 4 = 2

Thus, the y-intercept is (0, 2)

Now, putting y = 0, we get

-2(x – 1)2 + 4 = 0

⇒ (x – 1)2 = 2

⇒ x = ${1+\sqrt{2}}$ and x = ${1-\sqrt{2}}$

Thus, the x-intercepts are ${\left( 1+\sqrt{2},0\right)}$ and ${\left( 1-\sqrt{2},0\right)}$

Also, the vertex is (1, 4)

Since a = -2 (negative), the parabola opens downwards.

Thus, the function table is

xf(x)
-1-4
02
14
22
3-4

When plotting the x-values and their corresponding y-values, we get the required graph.

Which of the following graphs is a parabola?

Here, option a) is a U-shaped curve. Thus, it is a parabola.

Last modified on October 9th, 2024