Compound inequality or combined inequality includes two or more inequalities joined together either by Conjunction – ‘AND’ orDisjunction – ‘OR.’
Here are some examples of compound inequalities:
x < 3 or x > 7
x > 8 and x < 12
-5 ≤ x ≤ 10
Types
The two types of Compound inequalities are:
Conjunction – ‘AND’
In such inequalities, two conditions are true at the same time.
For example, x > 8 and x < 12 and -5 ≤ x ≤ 10 are examples of ‘AND’ – type compound inequality. -5 ≤ x ≤ 10 means the value of x is greater than equal to -5 and, simultaneously, less than equal to 10.
Disjunction – ‘OR’
In these inequalities, one of the two conditions is true.
For example, in the ‘OR’ – type compound inequality x < 3 or x > 7, the value of x is either less than 3 or more than 7. Both of them cannot be true.
Solving
Solving a compound inequality follows the same steps as solving a linear inequality. However, there are differences based on the inequality, whether it is a conjunction or a disjunction.
Conjunctions
Let us solve the inequality -4 < 2x + 6 < 4
Subtracting 6 from both sides, we get
-4 – 6 < 2x + 6 – 6 < 4 – 6
⇒ -10 < 2x < -2
On dividing both sides by 2, we get
-5 < x < -1 (Also, x > -5 and x < -1)
Thus, solving conjunctions involves solving each inequality separately, and the overlapping section is the solution of the given inequality.
Disjunctions
Similarly, let us solve the inequality x – 5 < -4 or x – 5 > 4
Adding 5 on both sides, we get
x – 5 + 5 < -4 + 5 or x – 5 + 5 > 4 + 5
⇒ x < 1 or x > 9
Thus, solving disjunctions involves solving each inequality separately and then uniting the solutions.
Graphing
Graphing a compound inequality follows the same steps as graphing a linear inequality. However, there are differences depending on whether the inequality is a conjunction or a disjunction.
Conjunctions
Let us graph the inequality -5 < x < -1 (x > -5 and x < -1).
Solve The Compound Inequalities
We observe that the solutions of inequalities are graphed on the number line as rays, where the open circle denotes x ≠ -5 and x ≠ -1.
They are also expressed using the ‘interval’ notation or the ‘intersection’ symbol (∩) between the intervals.
Here, the solution is (-5, -1) or (-5, ∞) ∩ (-∞, -1).
Now, plotting the graph of another compound inequality -5 ≤ x ≤ 10 (x ≥ -5 and x ≤ 10), we get
Graph The Compound Inequalities
Here, the closed circle denotes that ‘x’ can equal -5 or ‘x’ can equal 10.
Thus, [-5, 10] or [-5, ∞) ∩ (-∞, 10] is the required solution.
Disjunctions
Now, let us graph the compound inequality x < 1 or x > 9
Graphing each inequality on the number line, we get
Solving Compound Inequalities
In the graph, the open circle denotes x ≠ 1 and x ≠ 9. Using the ‘union’ symbol (∪) between the intervals, the above compound inequality can be written as (-∞, 1) ∪ (9, ∞)
Thus, the solution is (-∞, 1) ∪ (9, ∞)
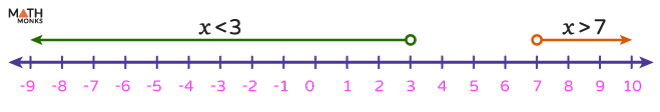
Now, let us graph another inequality x < 3 or x > 7
Graphing Compound Inequalities
Here, the open circle denotes x ≠ 3 and x ≠ 7, and thus, the required solution is (-∞, 3) ∪ (7, ∞)
Solved Examples
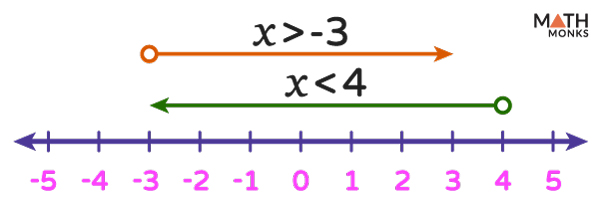
Solve the compound inequalities 2x – 5 > -11 and 2x + 1 < 9 and write the solution in the interval notation.
Solution:
Here the given inequalities are 2x – 5 > -11 and 2x + 1 < 9 On solving, we get ⇒ 2x – 5 + 5 > -11 + 5 (by addition property) and 2x + 1 – 1 < 9 – 1 (by subtraction property) ⇒ 2x > -6 and 2x < 8 ⇒ x > -3 (by division property) and x < 4 (by division property) Now, graphing the inequalities separately, Thus, the solution is (-3, 4)
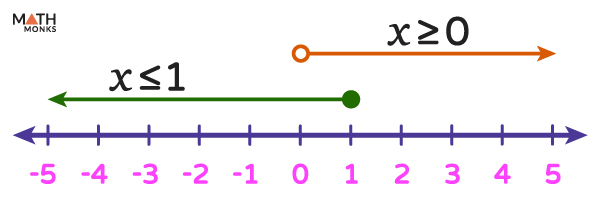
Solve the compound inequalities 5x – 4 ≤ 1 or 8x – 8 ≥ -8 and find the solution.
Solution:
Here the given inequalities are 5x – 4 ≤ 1 or 8x – 8 ≥ -8 ⇒ 5x – 4 + 4 ≤ 1 + 4 (by addition property) or 8x – 8 + 8 ≥ -8 + 8 ⇒ 5x ≤ 5 or 8x ≥ 0 ⇒ x ≤ 1 (by division property) or x ≥ 0 (by division property) Now, graphing the inequalities separately, Thus, the solution is the set of all real numbers.
Which compound inequality is represented by the following graph?
Solution:
Here, the given graph represents the compound inequality -4 ≤ x < 1 for the variable x.
About 10% of John’s time per day is spent watching TV. How long does he spend in about 2 to 3 days? Write and graph the compound inequality of the situation.
Solution:
Here, 10% of 1 day (24 hours) = 2.4 hours Using the interval notation, we conclude that John spends (4.8, 7.2) hours in 2 to 3 days, and its graph is plotted.