Last modified on April 12th, 2024

chapter outline


Graphing Inequalities

Graphing an inequality means representing its solutions on a coordinate plane. The steps of graphing vary depending on whether the inequality is linear or non-linear.

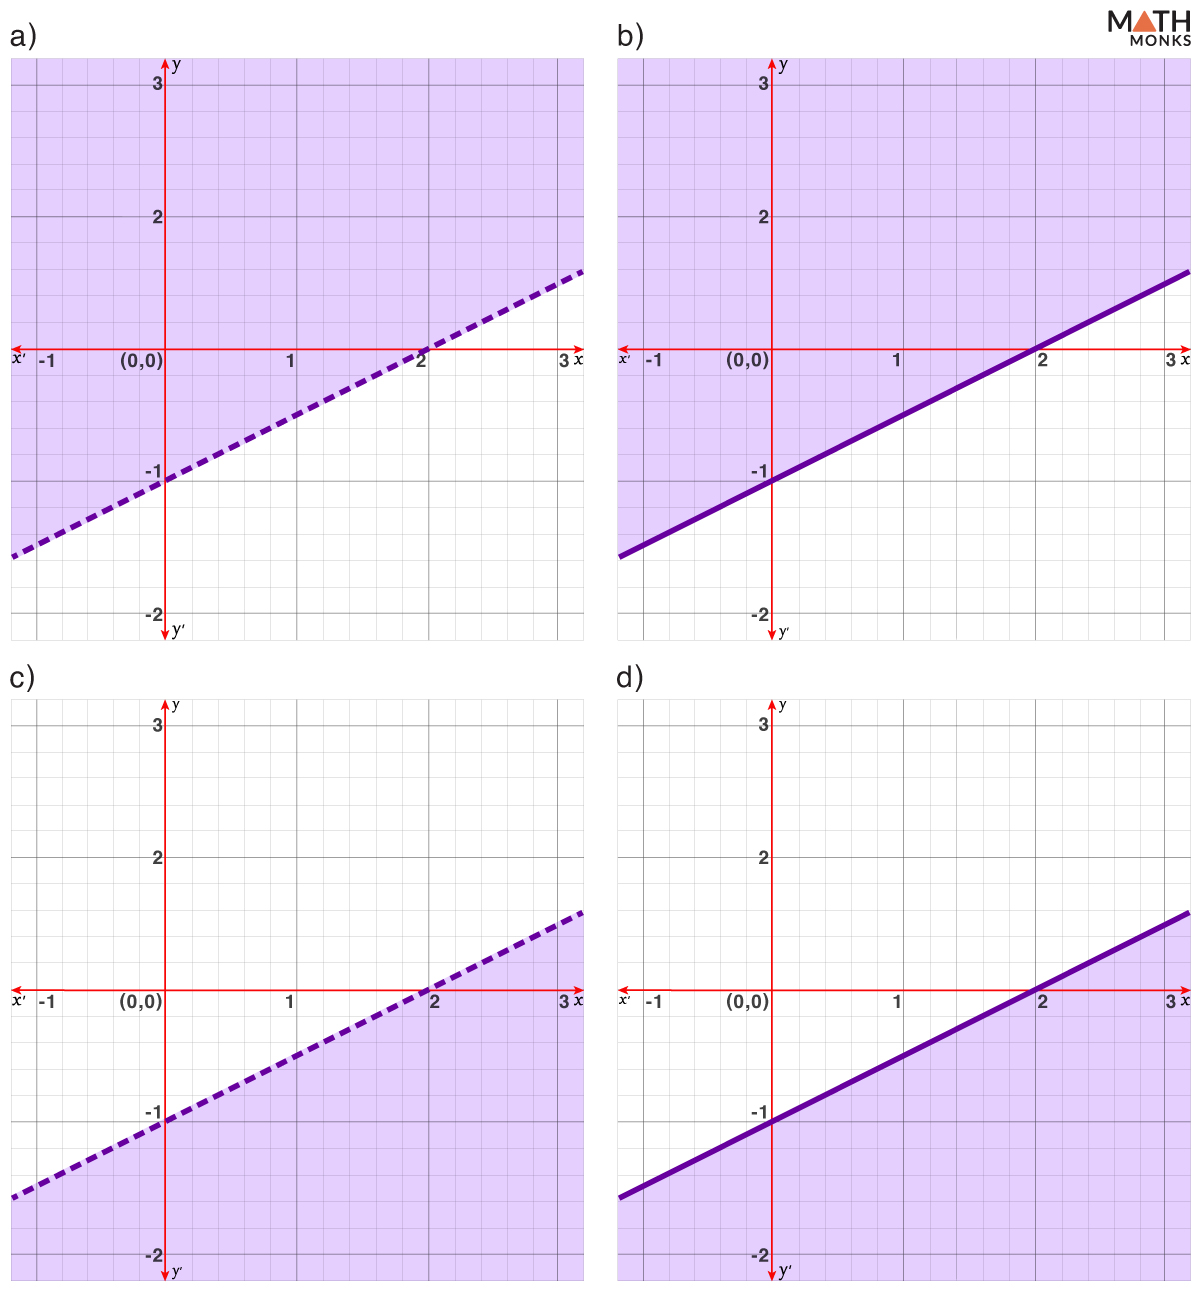
For graphing inequalities, we treat the inequality symbols ‘≥’ and ‘≤’ as ‘=’ and then graph the resulting equation. For such an equation with inequalities ≥’ or ‘≤’, the graph forms a solid line, whereas if the inequality is ‘<’ or ‘>,’ it is graphed as a dotted line. 

Next, we pick any point apart from those on the line and verify whether it satisfies the inequality. If it does, we shade the region that contains that point. Otherwise, the non-containing region is shaded.

Linear Inequalities

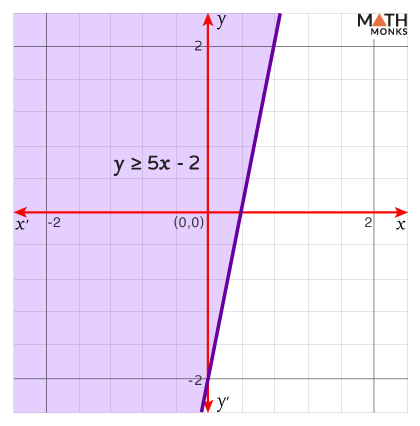
Let us plot the graph of the inequality y ≥ 5x – 2

Since, here, the inequality is ‘≥,’ the equation’s graph forms a solid line. This line divides the xy-plane into two regions: one that satisfies the inequality and one that does not.

Considering the point (x, y) as (-2, 0), we get 

5x – 2 = 5(-2) – 2 = -10 – 2 = -12

y = 0, and thus, 0 ≥ -12

Now, shading the region that contains (-2, 0), we get the graph as shown.

In the above graph, all the points in the shaded region satisfy the inequality y ≥ 5x – 2.

Non-linear Inequalities

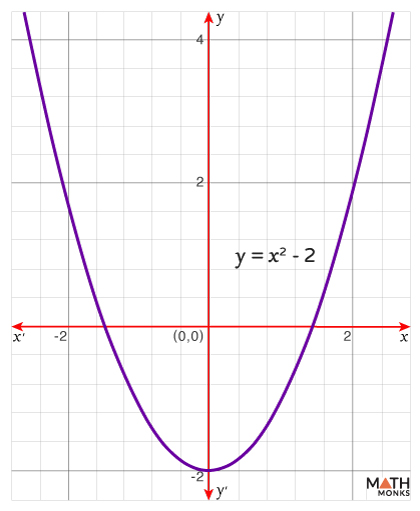
Now, let us plot the graph of y ≥ x2 – 2

Like the graph of the above linear inequality, here, we plot the graph of the equation y = x2 – 2 by considering the symbol ‘≥’ as an ‘=’ sign.

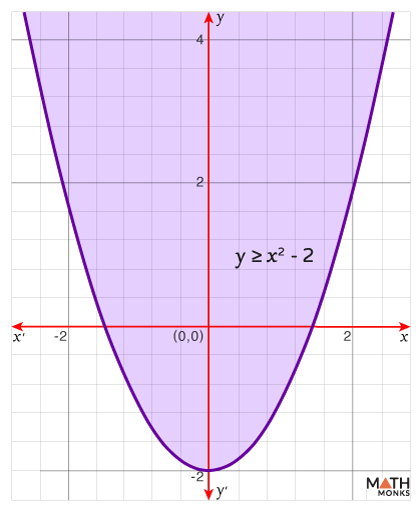
Since the inequality is ‘≥,’ the graph forms a solid line.

Now, we pick any point apart from those on the line and verify whether this point satisfies the inequality. 

Considering the point (x, y) as (0, -1), we get 

x2 – 2 = (0)2 – 2 = -2

y = -1, and thus, -1 ≥ -2

Now, shading the region that contains (0, -1) gives us a parabolic graph, as shown.

Thus, the shape of the curve for nonlinear inequalities varies depending on the specific form of the inequality. For example, quadratic inequalities typically result in curves such as parabolas, and cubic inequalities form curves with more complex shapes and multiple turning points.

Whereas, inequalities involving higher-order polynomials or transcendental functions (like exponential or trigonometric functions) produce even more diverse shapes.

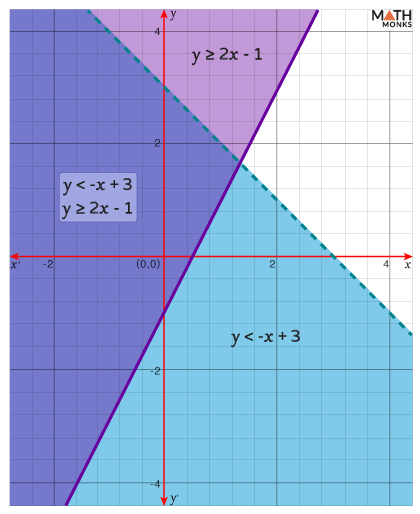
Systems of Inequalities

A system of inequalities is a set of two or more inequalities with one or more variables. It is represented graphically by the overlapped region between the individual solution sets.

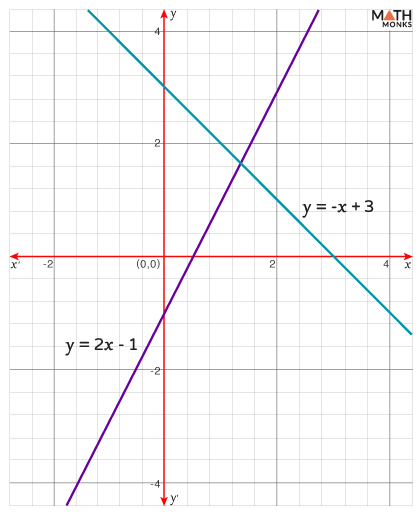
Let us consider the inequalities:

y < -x + 3 

y ≥ 2x – 1

To graph this system, we graph each inequality separately, as shown.

Now, we pick any point apart from those on the lines and verify whether this point satisfies the given inequalities. 

Considering the point (x, y) as (2, 0), we get 

-x + 3 = -2 + 3 = 1 > 0, and thus, 0 < 1

2x – 1 = 2(2) – 1 = 4 – 1 = 3 ≰ 0, and thus, 0 â‹¡ 3

The individual shaded regions and their overlapped parts are shown in the graph:

Here, the graph forms a dotted line for the first inequality ‘<,’ and a solid line for the second inequality ‘≥.’

Solved Examples

Example 1. Graph the inequality: 5x – 3y < 15

Plotting the graph of equation 5x – 3y = 15, we get

Now, we pick any point apart from those on the line and verify whether it satisfies the given inequality. 

Considering the point (x, y) as (4, -2), we get

5x – 3y = 5(4) – 3(-2) = 20 + 6 = 26

Thus, 26 ≮ 15

Now, shading the region that does not contain (4, -2), we get

In this graph, since the inequality is ‘<,’ the graph forms a dotted line.

Example 2. Graph the inequality: 4x – y2 < 0

Plotting the graph of equation 4x – y2 = 0, we get

Now, we pick any point apart from those on the line and verify whether it satisfies the given inequality. 

Considering the point (x, y) as (4, 0), we get

4x – y2 = 4(4) – (0)2 = 16

Thus, 16 ≮ 0

Now, shading the region that does not contain (4, 0), we get

In this graph, since the inequality is ‘<,’ the graph forms a dotted line.

Example 3. Which linear inequality is represented by the following graph?

Here, the given graph represents the inequality y > x.

Example 4. Which is the graph of the linear inequality 2x – 3y < 12?

As in the given inequality 2x – 3y < 12, the symbol is ‘<’; a dashed line will form in the graph.

Thus, the options c. and d. are omitted. 

Since the x-intercept is (6, 0), and the y-intercept is (0, -4), and putting (0, 0) in the given inequality, we get

2(0) – 3(0) = 0 < 12, which means the region will be shaded towards the point (0, 0)

Thus, the option b. is the required graph of the linear inequality 2x – 3y < 12

Example 5. Which is the graph of the linear inequality 2y > x – 2?

As in the given inequality 2y > x – 2, the symbol is ‘>’; a dashed line will form in the graph.

Thus, the options b. and d. are omitted. 

Since the x-intercept is (2, 0), and the y-intercept is (0, -1) and putting (0, 0) in the given inequality, we get

2y > x – 2 

⇒ 2y – x > -2

⇒ 2(0) – (0) = 2 > -2, which means the region will be shaded towards the point (0, 0)

Thus, the option a. is the required graph of the linear inequality 2y > x – 2

Example 6. Which is the graph of the linear inequality 6x + 2y > -10?

Here, the given inequality is 6x + 2y > -10

⇒ 3x + y > -5, where the inequality symbol is ‘>’

Thus, a dashed line will form. Thus, the options c. and d. are omitted. 

Now, calculating the x-intercept and the y-intercept, we get

The x-intercept = ${\left( \dfrac{-5}{3},0\right)}$

The y-intercept = ${\left( 0,-5\right)}$

Also, by putting (0, 0) in the given inequality, we get

6(0) + 2(0) = 0 > -10, which means the region will be shaded towards the point (0, 0)

Thus, option a. is the required graph of the linear inequality 6x + 2y > -10