Linear inequalities are algebraic expressions where the power of the unknown variable is no more than one, and the variable is connected with an inequality sign (>, <, ≤, or ≥).
7x – 12 > 16 and 5x + 11 < 2 are examples of linear inequalities
Rules to Solve
For Adding or Subtracting
Adding or subtracting a number on or from both sides of the inequality does not change its direction.
If a < b, then a + c < b + c
If a > b, then a + c > b + c
Similarly,
If a < b, then a – c < b – c
If a > b, then a – c > b – c
For Multiplying or Dividing
Like adding and subtracting, multiplying, or dividing an inequality by the same positive number also does not change the direction of the inequality.
If a < b and c > 0, then ac < bc
If a > b and c > 0, then ac > bc
If a < b and c < 0, then ac > bc
If a > b and c < 0, then ac < bc
Similarly,
If a < b and c > 0, then ${\dfrac{a}{c} <\dfrac{b}{c}}$
If a > b and c > 0, then ${\dfrac{a}{c} >\dfrac{b}{c}}$
If a < b and c < 0, then ${\dfrac{a}{c} >\dfrac{b}{c}}$
If a > b and c < 0, then ${\dfrac{a}{c} <\dfrac{b}{c}}$
Solving and Graphing
When solving a linear inequality, the solution is typically represented as an ordered pair (x, y) that satisfies the inequality, which is then graphed on a number line.
One-Step
Using the above rules, we solve the inequality x + 3 > 10
Step 1: Using the Subtraction Property
x + 3 – 3 > 10 -3
⇒ x > 7
Step 3: Graphing the Solution
Linear Inequalities 1
Two-Step
For One Variable
Let us try solving the inequality with one variable as 4x + 3 > 23
Step 1: Using the Subtraction Property
4x + 3 – 3 > 23 – 3
⇒ 4x > 20
Step 2: Using the Division Property
${\dfrac{4x}{4} >\dfrac{20}{4}}$
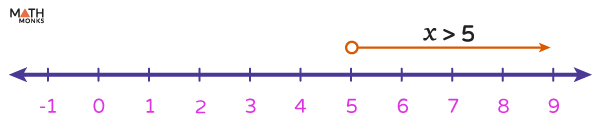
⇒ x > 5
Thus, the solution is x > 5
Step 3: Graphing the Solution
Linear Inequalities 2
For Two Variables:
Now, we solve the inequality 7y – 5x ≤ 6y – 3x + 3
Step 1: Solve for ‘x’ Using the Addition Property
7y – 5x + 5x ≤ 6y – 3x + 5x + 3
⇒ 7y ≤ 6y + 2x + 3
Step 2: Solve for ‘y’ Using the Subtraction Property
7y – 6y ≤ 6y + 2x + 3 – 6y
⇒ y ≤ 2x + 3
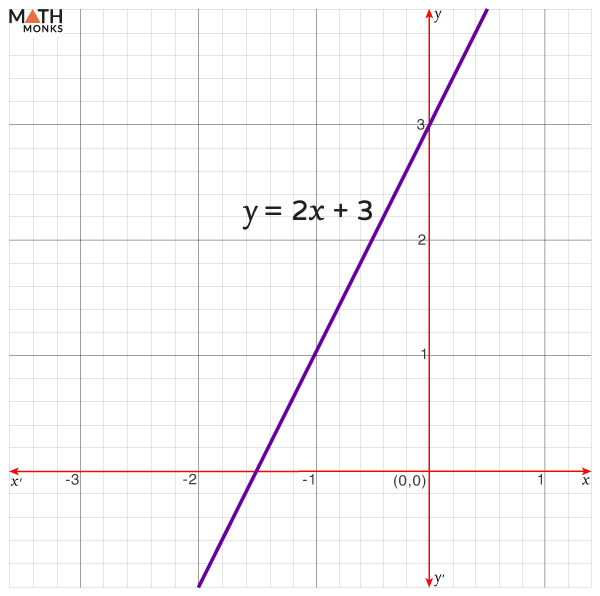
Step 3: Graphing the Solution
To plot a graph of the inequality y ≤ 2x + 3, we consider ‘≤’ as ‘=’ sign. Now, plotting the graph y = 2x + 3, we get
Linear Inequality Step 1
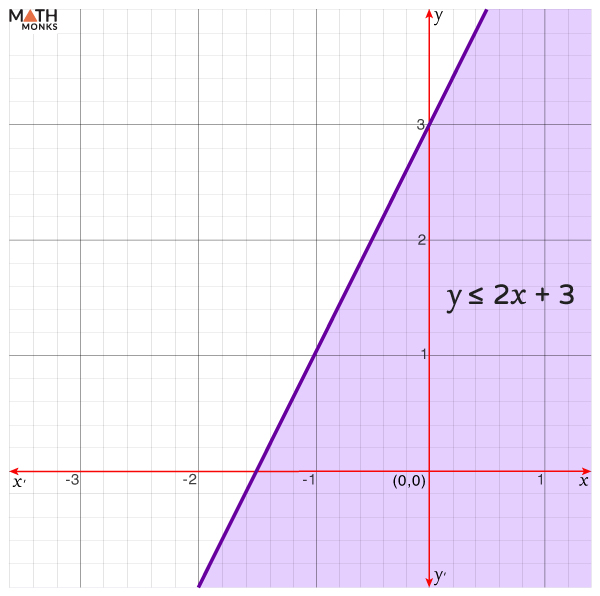
Since the inequality is ‘≥,’ the graph of the equation is formed as a solid line.
Now, considering a point (x, y) as (-2, 0), we get
2x + 3 = 2(-2) + 3 = -4 + 3 = -1, which is not greater than 0
Thus, y ≰ 2x + 3 at (-2, 0)
Now, shading the region that does not contain (-2, 0) shows the following graph.
Linear Inequality on Graph Step 2
Solved Examples
Solve and Graph the inequality with one variable: 2x + 5 < 3x
Solution:
Given, 2x + 5 < 3x Step 1: Using the Subtraction Property 2x + 5 – 2x < 3x – 2x ⇒ 5 < x ⇒ x > 5, which is graphed on the number line as shown.
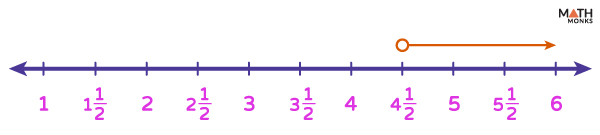
Solve and Graph the inequality with the variables on both sides: 7x – 5 > 3x + 13
Solution:
Given, 7x – 5 > 3x + 13 Step 1: Using the Addition and Subtraction Property 7x – 5 + 5 – 3x > 3x + 13 + 5 – 3x ⇒ 4x > 18 Step 2: Using the Division Property ⇒ x > ${\dfrac{18}{4}}$ (by division property) ⇒ x > ${\dfrac{9}{2}}$ However, linear inequalities with the same solution are called equivalent inequalities. Thus, 7x – 5 > 3x + 13 is equivalent to x > ${\dfrac{9}{2}}$ or x > ${4\dfrac{1}{2}}$ By plotting the solution on the number line, we get the shown graph.
Special Cases
Sometimes, plotting the solution of linear inequalities can form a horizontal line parallel to the x-axis or a vertical line parallel to the y-axis.
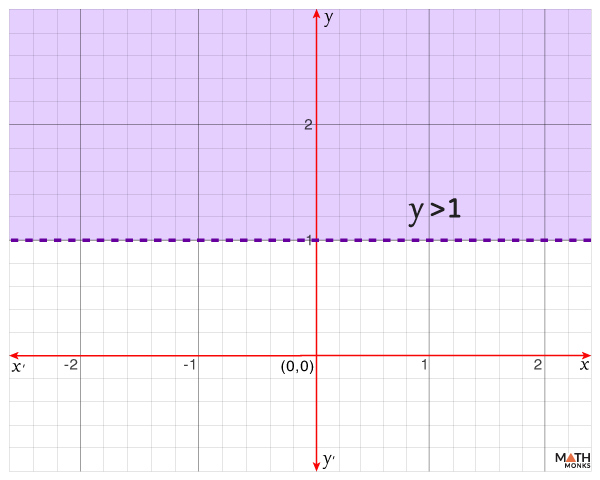
Case 1: When we plot the graph of the linear inequality y > 1 (‘y’ is greater than 1, excluding 1), the graph includes the entire region above the line y = 1, without the line y = 1 (shown in dotted form).
Graphing of Special Case 1
Case 2: When we plot the graph of the linear inequality x < 4 (‘x’ is less than 4, excluding 4), the graph includes the entire region left of line x = 4, without the line x = 4 (shown in dotted form).
Graphing of Special Case 2
System of Linear Inequalities
A system of linear inequalities consists of two or more linear inequalities with the same variables. Its solution includes all ordered pairs that simultaneously satisfy each inequality in the system.
Graphing
Graphically, the solution set is depicted as the intersection of the regions represented by each individual inequality on the coordinate plane.
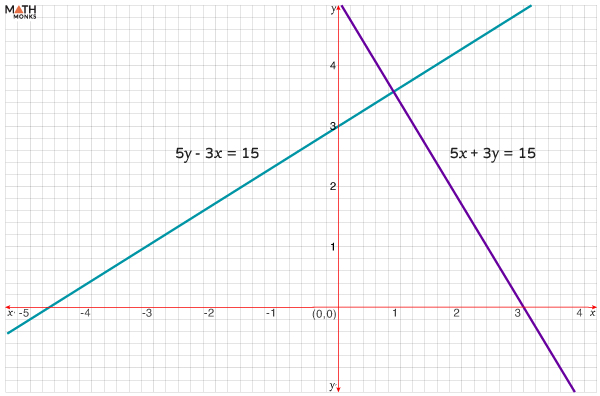
Let us consider the system of inequalities:
5y – 3x < 15 and 5x + 3y > 15
First, we graph each inequality separately, as shown.
Solving System of Linear Inequalities Step 1
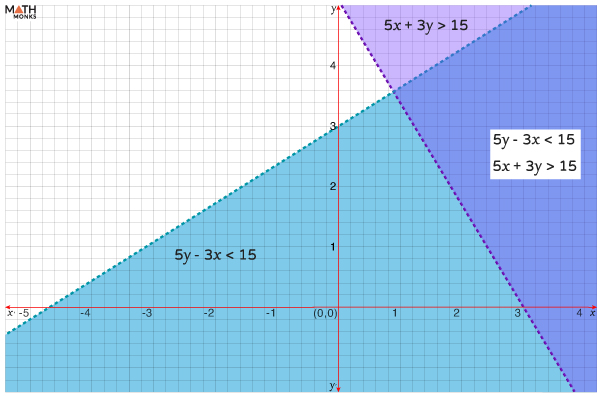
Now, let us pick a point that is not on the two given lines and verify whether this point satisfies the inequalities.
Considering the point (x, y) as (2, 1), we get
5y – 3x = 5(1) – 3(2) = 5 – 6 = -1, which is less than 15
5x + 3y = 5(2) + 3(1) = 10 + 3 = 13, which is not greater than 15
Thus, the individual shaded regions and their overlapped region are shaded:
Graphing Systems of Linear Inequalities Step 2
Here, the graphs are formed as dotted lines for the strict inequalities (‘<’ and ‘>’).
Solve and graph the linear inequality 6(x – 3) > 30
Solution:
Here, 6(x – 3) > 30 ⇒ x – 3 > 5 (by division property) ⇒ x > 5 + 3 (by addition property) ⇒ x > 8 Thus, the solution is x > 8, and its graph is as follows.
Solve the inequality 6(y – 5) < 5(4 + y)
Solution:
Here, 6(y – 5) < 5(4 + y) ⇒ 6y – 30 < 20 + 5y ⇒ 6y – 5y – 30 + 30 < 20 + 5y – 5y + 30 (by addition and subtraction property) ⇒ y < 50 Thus, the solution is y < 50
Which linear inequality is represented by the following graph?
Solution:
Here, the given graph represents the linear inequality x ≥ -2 for any variable x.


 Which linear inequality is represented by the following graph?