If we replace a quadratic equation’s equality sign (=) in the standard form ax2 + bx + c = 0 with an inequality sign, it becomes a quadratic inequality.
Here are a few examples of quadratic inequalities:
5x2 – 11x + 6 > 0
x2 + 5x – 6 < 0
Standard Forms
Depending on the sign, the 4 standard forms of quadratic inequality are:
ax2 + bx + c > 0
ax2 + bx + c < 0
ax2 + bx + c ≥ 0
ax2 + bx + c ≤ 0
Here, like a quadratic equation, ‘a’ (≠ 0), ‘b,’ and ‘c’ are the constants, and ‘x’ is a variable.
Solving
Solving quadratic inequalities involves finding the value of the variable that satisfies the inequality. It can be done both graphically and algebraically.
Graphically
While solving quadratic inequalities graphically, we find the intervals where the inequality is either above or below the x-axis, depending on the inequality sign.
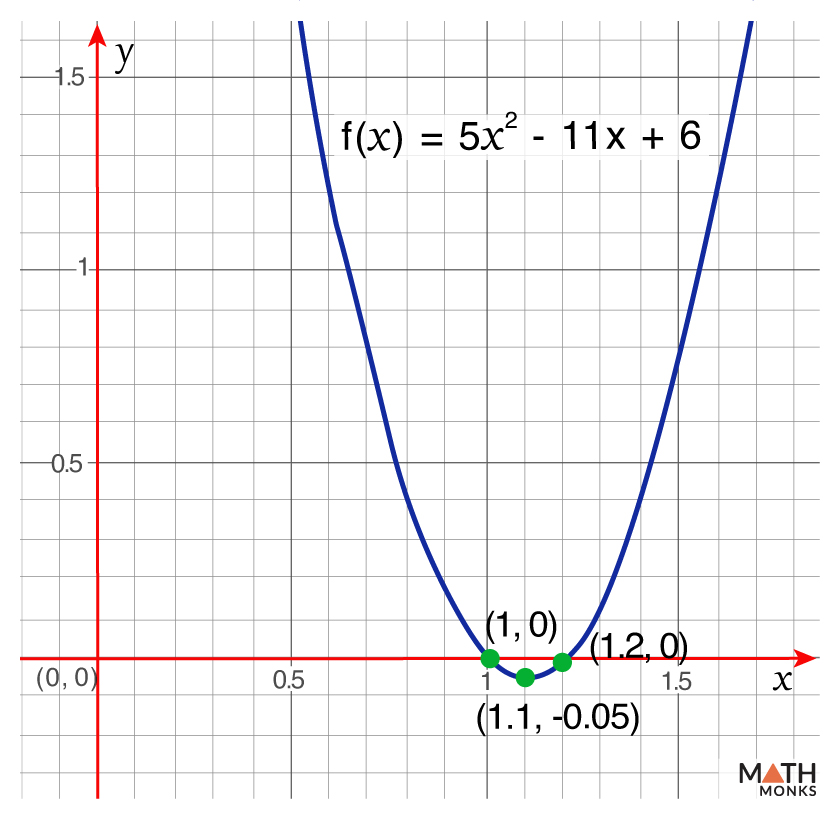
To understand the concept, let us solve the inequality 5x2 – 11x + 6 > 0.
Step 1. Writing in Standard Form
5x2 – 11x + 6 > 0, which is in its standard form (ax2 + bx + c > 0).
Thus, the vertex is ${\left( \dfrac{11}{10},\dfrac{-1}{20}\right)}$ ⇒ (1.1, -0.05)
Finding the x-intercepts
By putting f(x) = 0, we get
5x2 – 11x + 6 = 0
⇒ 5x2 – 5x – 6x + 6 = 0
⇒ (x – 1)(5x – 6) = 0
⇒ x = 1, ${\dfrac{6}{5}}$
⇒ x = 1, 1.2
Thus, x-intercepts are (1, 0) and (1.2, 0)
Now, graphing the quadratic function f(x) = 5x2 – 11x + 6, we get
How to Graph Quadratic Inequalities Step 1
Step 4. Determining the Solution Set
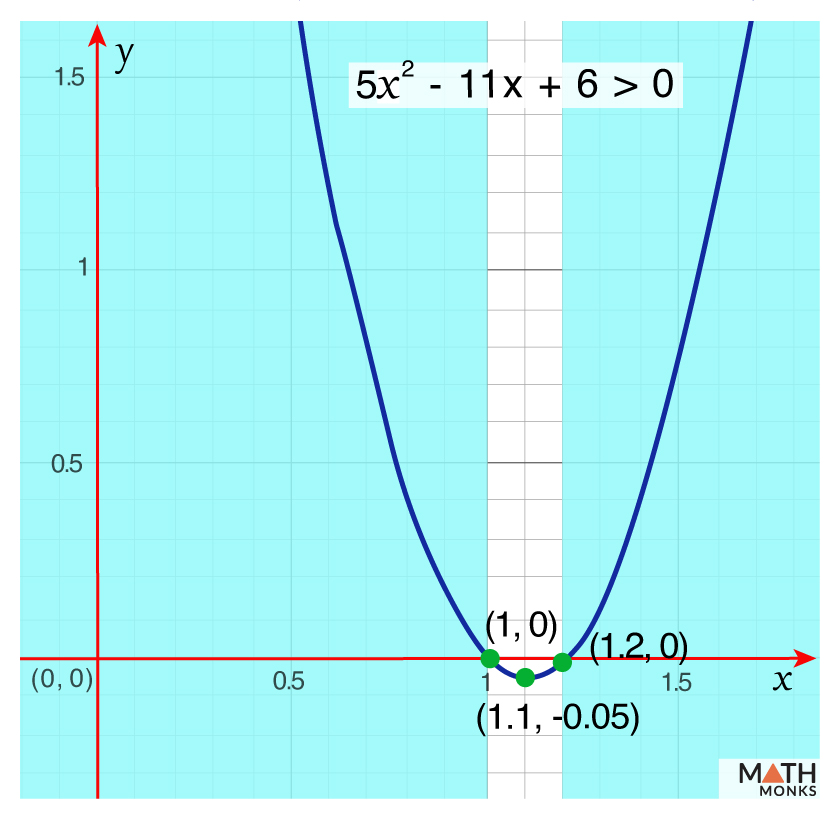
Since the inequality has a ‘>’ sign, the vertices are not included, and the solution set is (-∞, 1) ∪ (1.2, ∞). On graphing the solution, we get
Graphing Quadratic Inequalities Step 2
Algebraically
Let us solve the inequality x2 + 5x – 6 < 0
Step 1.Writing in Standard Form
x2 + 5x – 6 < 0, which is in its standard form of ax2 + bx + c < 0.
Step 2.Determining the Critical Points
Factoring the inequality, we get
x2 + 5x – 6 < 0
⇒ x2 + 6x – x – 6 < 0
⇒ (x + 6)(x – 1) < 0
Now, finding the critical points (the solutions) to the related quadratic equation, we get
(x + 6)(x – 1) = 0
⇒ x = -6, 1
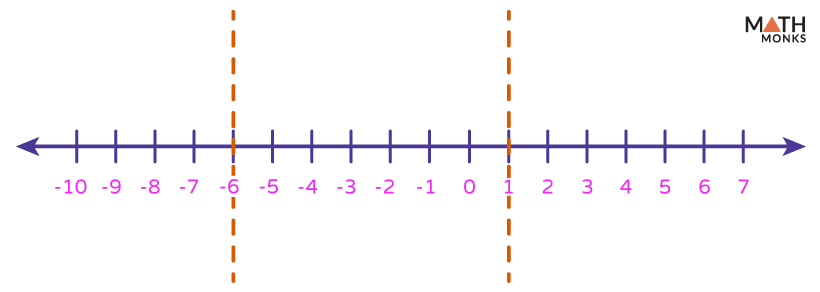
Step 3. Dividing the Number Line into Intervals with the Critical Points
How Do You Solve Quadratic Inequalities Step 1
Step 4.Determining the Sign of the Expression for Distinct Intervals
At x = -10 (< -6), (-10)2 + 5(-10) – 6 = 44 ≮ 0
At x = -1 (> -6 but < 1), (-1)2 + 5(-1) – 6 = -10 < 0
At x = 5 (> 1), (5)2 + 5(5) – 6 = 44 ≮ 0
Thus, at -6 < x < 1, the inequality holds.
Step 5.Representing the Solution Set on the Number Line
How to Solve The Quadratic Inequality Step 2
Here, the solution set of the quadratic inequality is (-6, 1), the interval notation.
Solved Examples
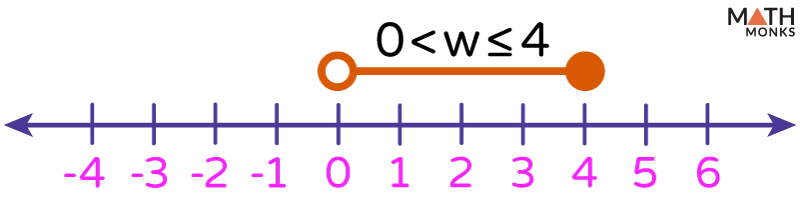
The length of a rectangular box is 18 meters more than thrice its width. Find all possible rectangle widths that would result in an area of no more than 120 square meters and graph the solution on a number line.
Solution:
Let ‘l’ and ‘w’ be the length and width of the rectangular box. As we know, the length is 18 meters, more than thrice the width Here, l = 18 + 3w Area = l ⋅ w = w(18 + 3w) = 18w + 3w2 Since the area cannot exceed 120 m2 Thus, 18w + 3w2 ≤ 120 ⇒ 3w2 + 18w – 120 ≤ 0 ⇒ w2 + 6w – 40 ≤ 0 ⇒ w2 + 10w – 4w – 40 ≤ 0 ⇒ (w + 10)(w – 4) ≤ 0 Now, finding the critical points (the solutions) to the related quadratic equation, we get (w + 10)(w – 4) = 0 ⇒ w = -10, 4 Here, the interval points are -10 and 4. Now, at w = -11 (< -10), 3(-11)2 + 18(-11) = 363 – 198 = 165, which is not less than 120 At w = 0 (> -10 but < 4), 3(0)2 + 18(0) = 0, which is less than 120 At w = 5 (> 4), 3(5)2 + 18(5) = 165, which is not less than 120 Thus, at -10 < w < 4, the inequality holds. Since the width cannot be negative, the only valid solution is 0 < w ≤ 4 Thus, all possible rectangle widths resulting in an area of no more than 120 square meters are w ≤ 4 meters, which means w = {1, 2, 3, 4}
Which quadratic inequality does the graph below represent? a) y > x2 + 3x + 2 b) y < x2 + 3x + 2 c) y > x2 – 3x – 2 d) y < x2 – 3x – 2
Solution:
As we know, the y-intercept is 2, not -2 The options c) and d) are eliminated. Now, on factoring the quadratic expressions, x2 + 3x + 2 = x2 + 2x + x + 2 = (x + 2)(x + 1) The x-intercepts are (-1, 0) and (-2, 0) Since the shaded part is above the curve. Thus, a) is the correct quadratic inequality, which represents the given graph.

 Which quadratic inequality does the graph below represent?