A system of inequalities is a set of two or more inequalities involving the same variables. They are used when the problem has a range of solutions.
Notations Used
The systems of inequalities follow the same notations as linear inequalities.
> Greater than
< Less than
≥ Greater than or equal to
≤ Less than or equal to
= Not equal to
The systems of inequalities follow some notations of sets.
Intersection (∩)
An intersection of two or more inequalities contains the set of all numbers that satisfy the inequalities. It is represented by the ‘∩’ symbol (or by the ‘and’ statement) between the inequalities
y > -4 ∩ y < 9, equivalent to -4 < y < 9
In set builder notation, {y | y > -4 ∩ y < 9}, read as ‘y is greater than -4 and y is less than 9.’
An intersection of inequalities is sometimes denoted with a left curl bracket ‘{,‘ placed left to the inequalities.
For example,
${\begin{cases}y <9\\ y >-4\end{cases}}$
Union (∪)
A union of two or more inequalities contains the set of all numbers satisfying either of the given inequalities. It is represented by the ‘∪’ symbol (or by the ‘or’ statement) between the inequalities
x < -2 ∪ x > 8
In set builder notation, {x | x < -2 ∪ x > 8}, read as ‘x is less than -2 or x is greater than 8’
In One Variable
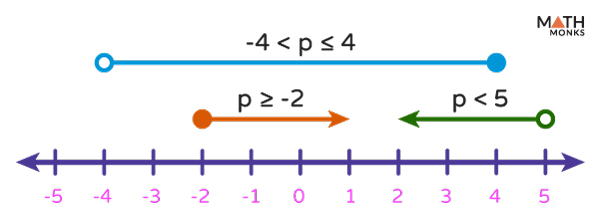
Let us consider the system of inequalities in one variable:
Putting each inequality on the number line, we get
System of Inequalities 1
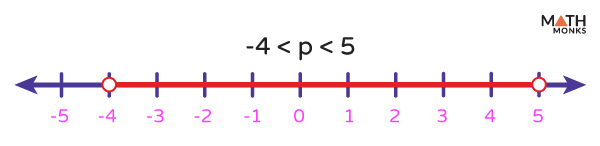
Now, shading the overlapped region on the number line, we get
Systems of Inequalities 2
Here, the solution or the intersection of the system of inequalities is shaded.
However, for the union of the above system of inequalities, the shaded part is:
Solving Systems of Inequalities 3
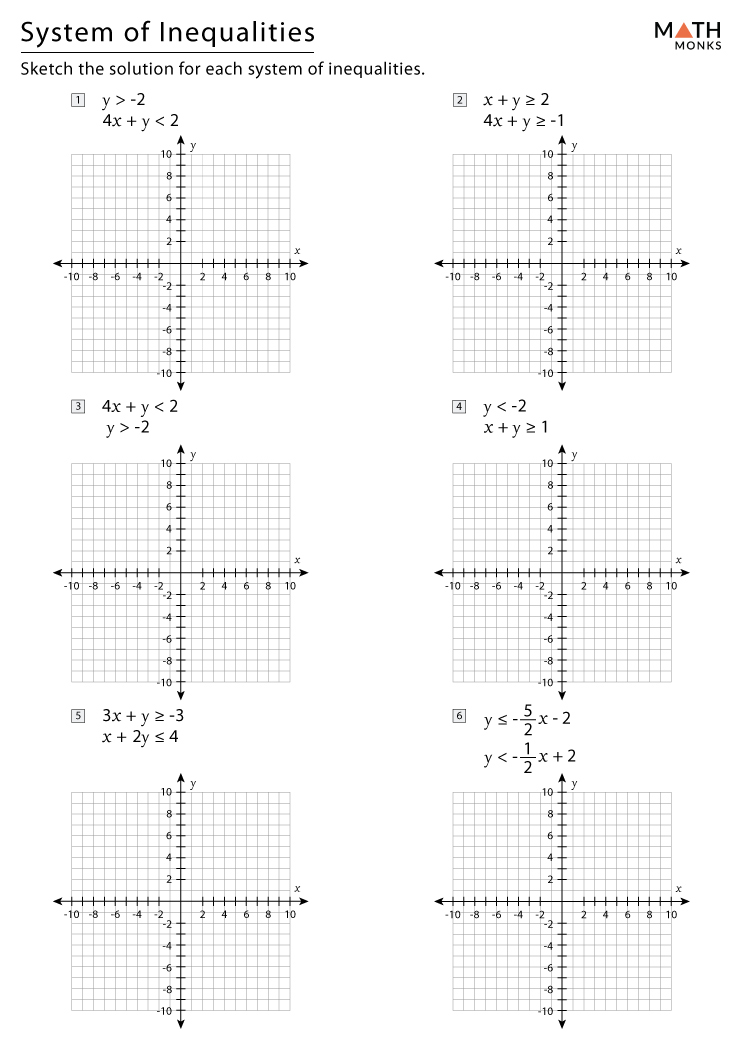
In Two Variables
However, the solutions to the system of inequalities (linear or nonlinear) in two variables cannot be plotted on a number line. It is shown by the common shaded region on the coordinate plane.
The solution is determined by the areas where the points satisfy the system of inequalities. In the case of a solid line, the points along the line constitute the solution. A dashed line contains an adjacent shaded region in the solution, excluding its points.
Linear Inequalities
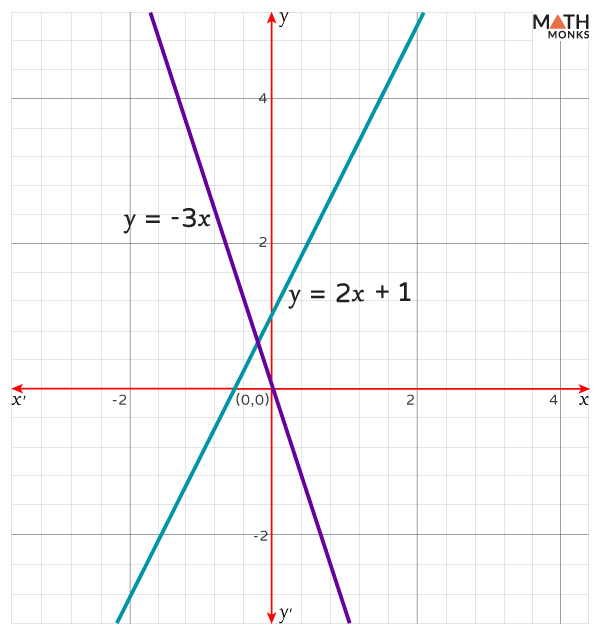
Let us consider the system of linear inequalities
y < 2x + 1 ∪ y > -3x
Graphing the lines of each inequality, we get
Graphing Systems and Inequalities Step 1
Since the inequalities are strict, the lines are dashed. Now, we pick a point that is not on the lines and verify whether this point satisfies the inequalities.
Considering the point (x, y) as (2, 0), we get
2x + 1 = 2(2) + 1 = 5, which is greater than 0
-3x = -3(2) = -6, which is less than 0
Thus, y < 2x + 1 and y > -3x at (2, 0)
Now, shading the regions accordingly,
System of Inequalities Graph Step 2
Since this system is a union, all shaded parts are the solution to the inequality system.
We observe that the solution can also be found using the up/down method. Here, the shaded region is down the line of y < 2x + 1 (y is less than 2x + 1), and the shaded region is up the line. of y > -3x (y is greater than -3x).
Nonlinear Inequalities
A system of nonlinear inequalities contains at least one inequality that is not linear. This system can be graphed like the linear system, using the up/down method or testing the points.
Let us consider the system of nonlinear inequalities
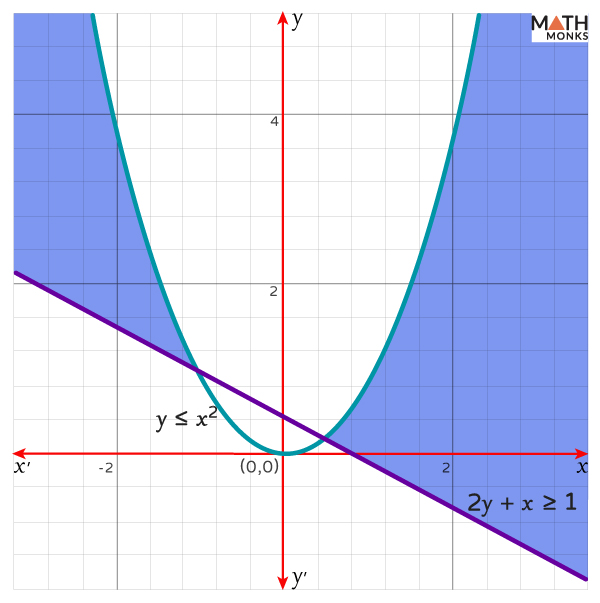
y ≤ x2 and 2y + x ≥ 1
Plotting each inequality separately,
Graphing Systems and Nonlinear Inequalities Step 1
By the up/down method,
Graphing System of Nonlinear Inequalities Step 2
Here, for y ≤ x2, the shaded region is down the curve, and for 2y + x ≥ 1, the shaded region is up the line. Since this system is an intersection, the overlapped parts are the only solution to the inequality system, as shown.
Graphing System of Nonlinear Inequalities Step 3
Similarly, we find a solution by testing the regions’ points. A system of inequalities is used to determine the maximum or minimum values of a situation with multiple constraints, such as in budget planning, supply chain management, and engineering design.
Solved Examples
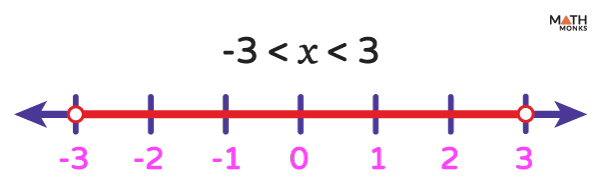
Solve and Graph the intersection of the inequalities 3x – 4 < 5 ∩ 2x + 1 > -5
Solution:
Here, 3x – 4 < 5 ∩ 2x + 1 > -5 ⇒ 3x < 5 + 4 ∩ 2x > -5 – 1 (by addition and subtraction property) ⇒ 3x < 9 ∩ 2x > -6 ⇒ x < 3 ∩ x > -3 (by division property) Putting each inequality on the number line, we get
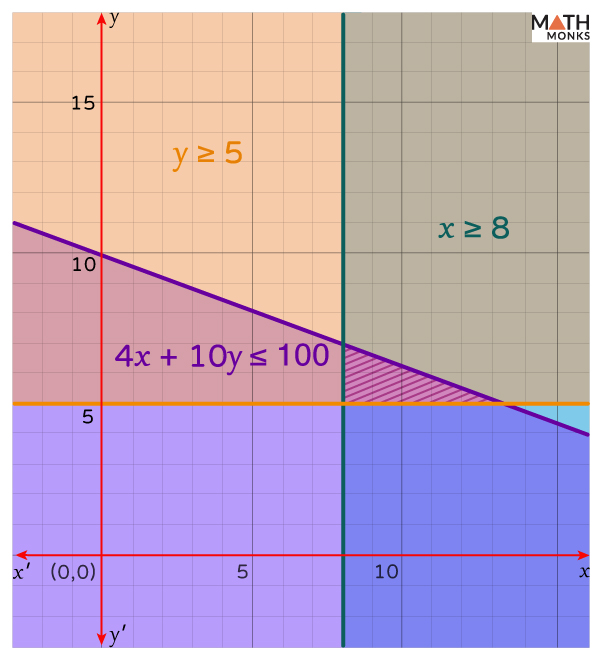
Logan is buying pizzas and sandwiches for a picnic. Each pizza cost \$10, and each sandwich cost \$4. He wishes to buy 8 sandwiches and 5 pizzas but can only spend up to $100. Find the system of inequalities and graph its possible solution to the situation.
Solution:
Let x and y be the number of sandwiches and pizzas bought by Logan. Thus, the system of inequalities is: 4x + 10y ≤ 100, x ≥ 8, and y ≥ 5 Its graph is: Here, the shaded region is the required solution to the inequality system.
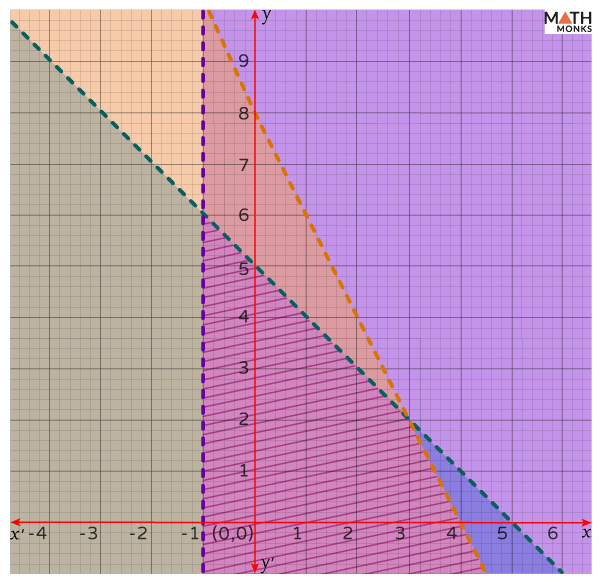
Which system of linear inequalities is represented by the graph? a) x + 2 < 1, y + x < 5, and y + 2x > 8 b) x – 2 > 1, y – x < 5, and y – 2x < 8 c) x + 2 > 1, y + x < 5, and y + 2x < 8 d) x + 2 > 1, y – x > 5, and y + 2x < 8
Solution:
Here, we consider all the inequalities as the equations in slope-intercept form. x + 2 = 1 ⇒ x = -2 + 1 ⇒ x = -1 …..(i) x – 2 = 1 ⇒ x = 2 + 1 ⇒ x = 3 …..(ii) y + x = 5 ⇒ y = -x + 5 …..(iii) y – x = 5 ⇒ y = x + 5 …..(iv) y + 2x = 8 ⇒ y = -2x + 8 …..(v) y – 2x = 8 ⇒ y = 2x + 8 …..(vi) In the given graph, The x-intercepts are (5, 0), (-1, 0), and (4, 0) The y-intercepts are (0, 5) and (0, 8) Here, one line exists, which is parallel to the y-axis. By considering all the equations in slope-intercept form, we have: From (i), the x-intercept is (5, 0), and the line is parallel to the y-axis From (iii), the x-intercept is (5, 0), and the y-intercept is (0, 5) From (v), the x-intercept is (4, 0), and the y-intercept is (0, 8) Now, the given graph shows the common shaded regions of the system of inequalities. Thus, option c. will be the answer, where the system of inequalities x + 2 > 1, y + x < 5, and y + 2x < 8 together show the intersection area of their regions.


 Which system of linear inequalities is represented by the graph?