The basic form of a logarithmic function is y = f(x) = logbx (0 < b ≠ 1), which is the inverse of the exponential function by = x.
The logarithmic functions can be in the form of ‘base-e-logarithm’ (natural logarithm, ‘ln’) or ‘base-10-logarithm’ (common logarithm, ‘log’).
Here are some examples of logarithmic functions:
f(x) = log5x
g(x) = log(3x – 1)
h(x) = ln(4x) + 2
Finding Domain and Range
The domain of the function y = logbx is x > 0 or (0, ∞) and the range of any logarithmic function is the set of real numbers.
Let us determine the domain of the logarithmic function g(x) = log(3x – 1)
Setting the argument, 3x – 1 > 0, we get
3x > 1
⇒ x > ${\dfrac{1}{3}}$
Thus, the domain is ${\left( \dfrac{1}{3},\infty \right)}$ and the range is the set of ℝ.
Finding Asymptote
As we know, the domain of the above function g(x) = log(3x – 1) is ${\left( \dfrac{1}{3},\infty \right)}$.
Now, to find the asymptote of the logarithmic function, we solve for x by putting 3x – 1 = 0.
We get 3x = 1
⇒ x = ${\dfrac{1}{3}}$
Thus, the vertical asymptote is x = ${\dfrac{1}{3}}$.
Graphing Basic Logarithmic Functions
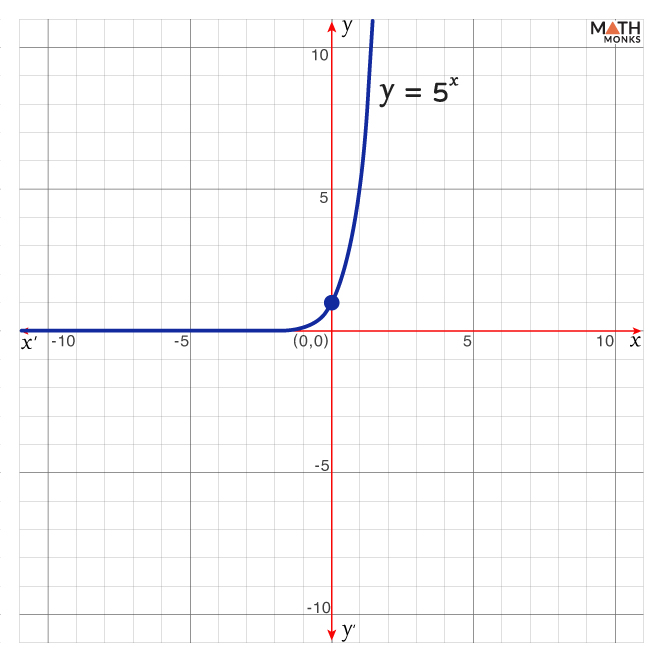
Let us graph the logarithmic function y = f(x) = log5x considering its inverse (in the form of the exponential function) 5x = y
Now, the exponential function y = 5x can be graphed as
The graph representing the inverse of a function mirrors the graph of the original function.
Thus, the logarithmic function y = log5x, the inverse of y = 5x, is the reflection of the previous graph, as shown.
Alternative Method
However, the graph of the logarithmic function with base ‘b’ (y = logbx) can also be obtained by converting its exponential form x = by
Let us plot y = log3x.
First, we convert y = log3x to its exponential form, x = 3y
Now, considering the values of x and y, we get:
y
x = 3y
(x, y)
-2
${3^{-2}=\dfrac{1}{9}}$
${\left( \dfrac{1}{9},-2\right)}$
-1
${3^{-1}=\dfrac{1}{3}}$
${\left( \dfrac{1}{3},-1\right)}$
0
30 = 1
(1, 0)
1
31 = 3
(3, 1)
2
32 = 9
(9, 2)
By plotting all the points to graph the function y = log3x, we get
By summarizing all these methods, the graphs of the given logarithmic functions are represented as follows:
We observe that the graph y = logbx has domain D = {x: x > 0}, a vertical asymptote at x = 0, and an x-intercept at x = 1. Also, if b > 1, the graph increases, and if 0 < b < 1, it decreases, and the range is all the real numbers.
Transformations of Graphs
Transformations of any logarithmic function’s graph are similar to those of the other function, including shift, stretch, compress, and reflection of the parent function y = f(x) = logbx.
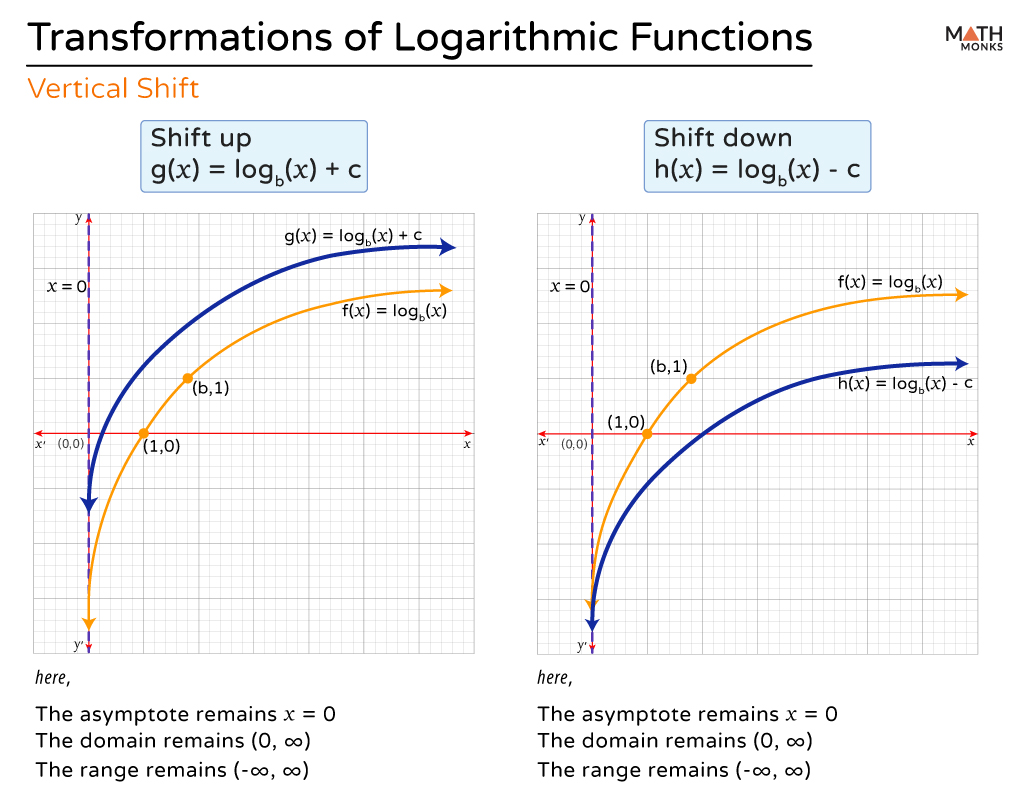
Vertical Shifts
When we add or subtract a constant ‘c’ to the logarithmic function f(x) = logbx, we get a result that is vertically shifted in the direction of the sign on ‘c.’
Here, the curve of f(x) = logbx is formed alongside the shift up (g(x) = logbx + c) and the shift down (h(x) = logbx – c), as shown.
Here, the graph of f(x) = logb(4x) + 2 along with its parent function are shown:
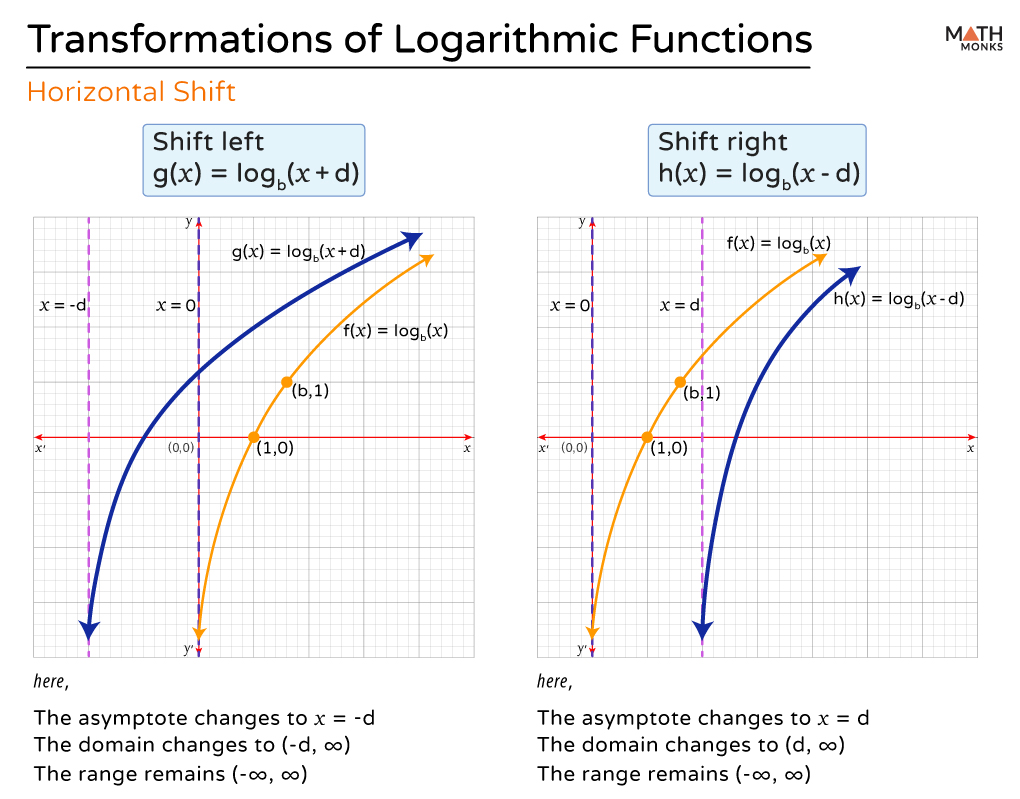
Horizontal Shifts
The logarithmic function f(x) = logbx can be shifted ‘d’ units horizontally with respect to the equation f(x) = logb(x + d). Thus, if d > 0, the curve f(x) = logb(x + d) shifts in the left direction, whereas when d < 0, the curve f(x) = logb(x – d) shifts in the right direction.
The graph of f(x) = logbx with its shifted forms is shown.
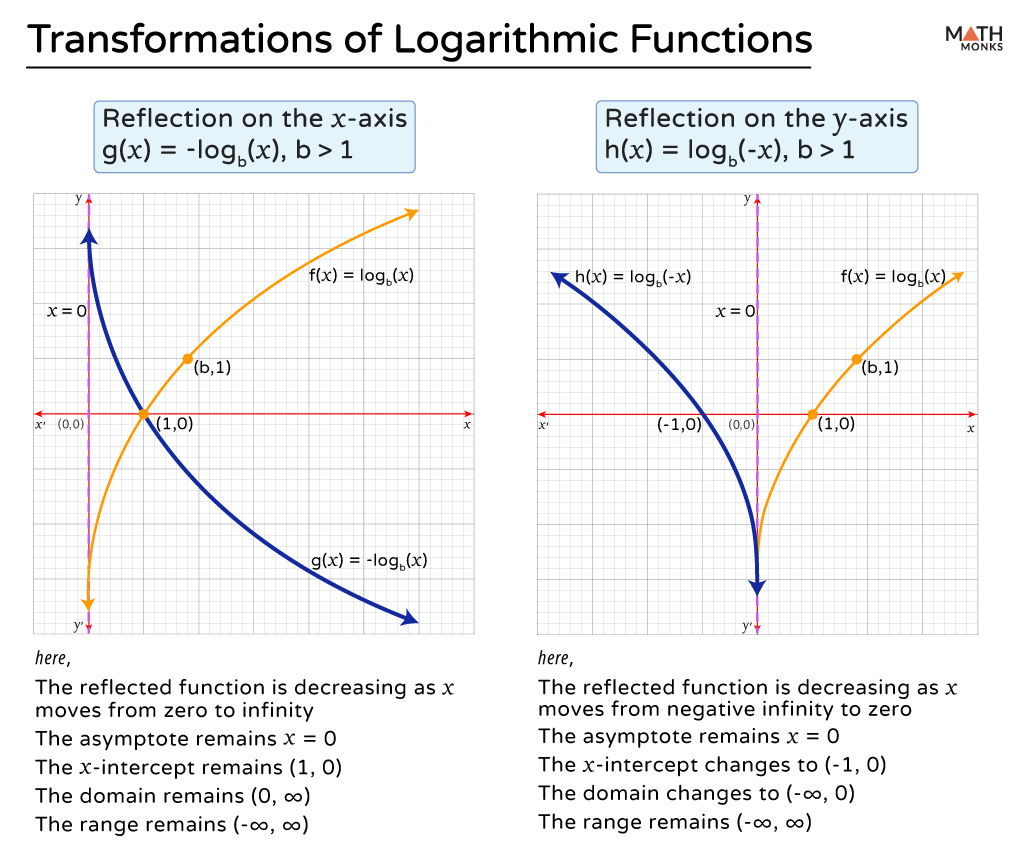
Reflections
When we multiply the parent function f(x) = logbx by (-1), we get the result as a reflection on the x-axis. Similarly, when we multiply the argument of the function f(x) = logbx with (-1), we get the reflection on the y-axis.
Here is a general curve of the logarithmic function f(x) = logbx with its reflections of the x-axis (g(x) = – logbx) and y-axis (h(x) = logb(-x)).
For example, the graph of g(x) = ln(-x), along with its parent function f(x) = ln(x) is shown:
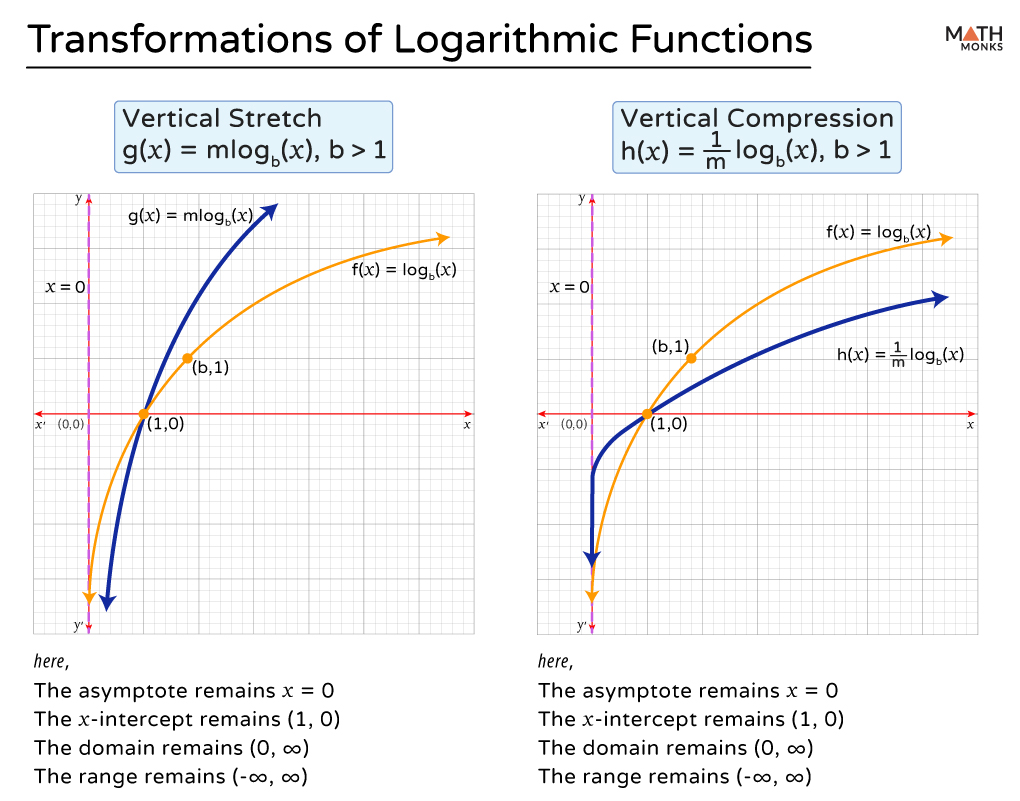
Vertical Stretches and Compressions
On multiplying the parent function f(x) = logbx by the constant ‘m’ (m > 0), we get a vertical stretch or compression of the original graph, and the functions are:
On multiplying the argument of the parent function f(x) = logbx by the constant ‘n’ (n > 0), we get the horizontal stretch or horizontal compression of the original graph, and the functions are:
Horizontal stretch, g(x) = logb(nx), here n > 0
Horizontal compression, h(x) = logb(nx), here 0 < n < 1
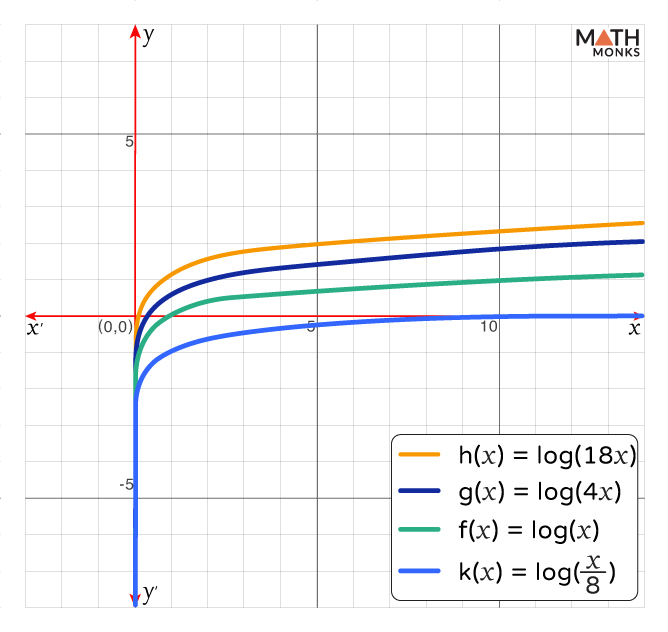
Here are the graphs of the functions log(x), log(4x), and log(18x).
Finding the Equation of a Graph
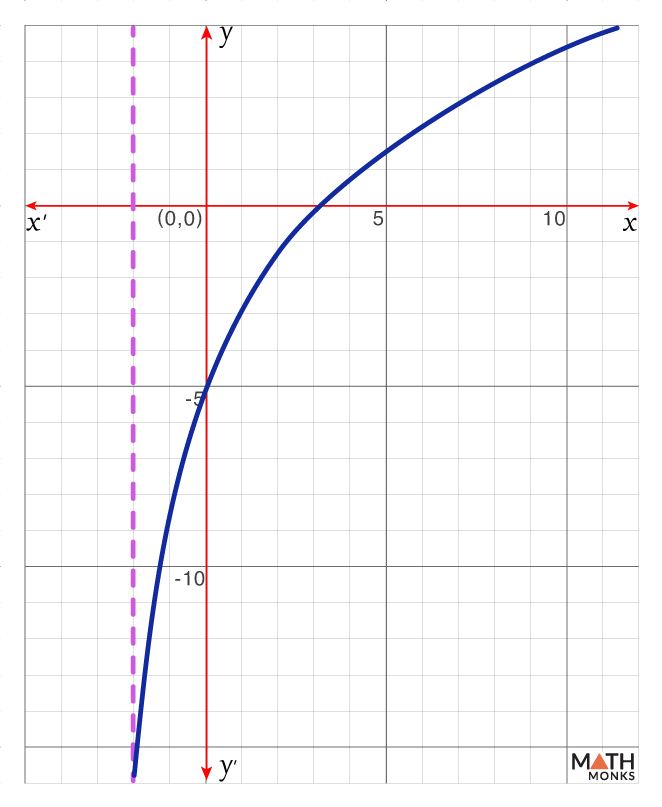
Now, let us find a possible equation for the following graph of a common logarithmic function.
Since the given logarithmic function is horizontally shifted to the left and has a vertical asymptote at x = -2, the argument of the logarithmic function is (x + 2).
Again, since the graph is vertically shifted down and reflected on the y-axis, the logarithmic equation can be written as y = m logb(x + 2) – c.
As we know, logb(1) = 0.
Thus, if x + 2 = 1 (or, x = -1), y = -c.
From the graph, when x = -1, we get y = -7, which implies -c = -7
Now, the logarithmic equation is y = m logb(x + 2) – 7
Also, logb(b) = 1
Thus, if x + 2 = b, y = m – 7.
Since the given graph is of a common logarithmic function with base 10 (b = 10)
If b = 10, x = b – 2 = 8.
From the graph, when x = 8, we get y = 3, and m = y + 7 = 10
Thus, the logarithmic equation of the given graph is y = 10 log10(x + 2) – 7 or 10 log(x + 2) – 7
Alternative Method
As we know, the general form of the logarithmic function is y = m logb(x + 2) – c, and the graph passes through the points (-1, -7) and (8, 3).
Substituting the values x = -1 and y = -7, we get
-7 = m logb(-1 + 2) – c
⇒ -7 = m logb(1) – c
⇒ -7 = -c (since logb(1) = 0)
Now, the equation is y = m logb(x + 2) – 7
By substituting the values x = 8 and y = 3, we get
⇒ ${y=10\log _{10}\left( x+2\right) -7}$ (by the change of base rule)
Thus, the logarithmic equation of the given common logarithmic graph is y = 10 log10(x + 2) – 7 (or, 10 log(x + 2) – 7)
Solved Examples
Find the domain and the asymptote of the logarithmic function y = 3 log4(x – 5) + 2.
Solution:
Setting the argument, x – 5 > 0, we get x > 5 Thus, the domain is x > 5 or (5, ∞) By putting x – 5 = 0, we get x = 5 Thus, the vertical asymptote is at x = 5.
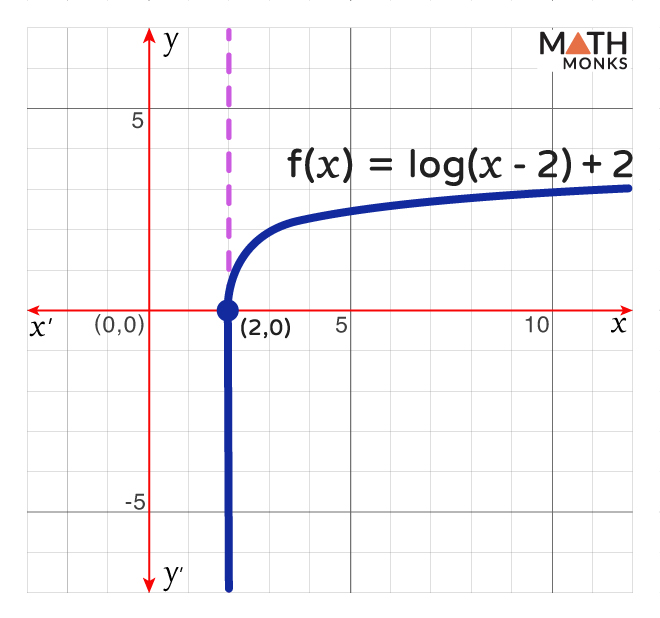
Draw the graph of the function f(x) = log(x – 2) + 2 and find its domain, range, and asymptote.
Solution:
Here, f(x) = log(x – 2) + 2 Setting the argument, x – 2 > 0, we get x > 2 Thus, the domain is x > 2 or (2, ∞) By putting x – 2 = 0, we get x = 2 Thus, the vertical asymptote is at x = 2 Since the range of any logarithmic function is the set of real numbers, the range of f(x) is (-∞, ∞) The given function f(x) = log(x – 2) + 2 is graphed as
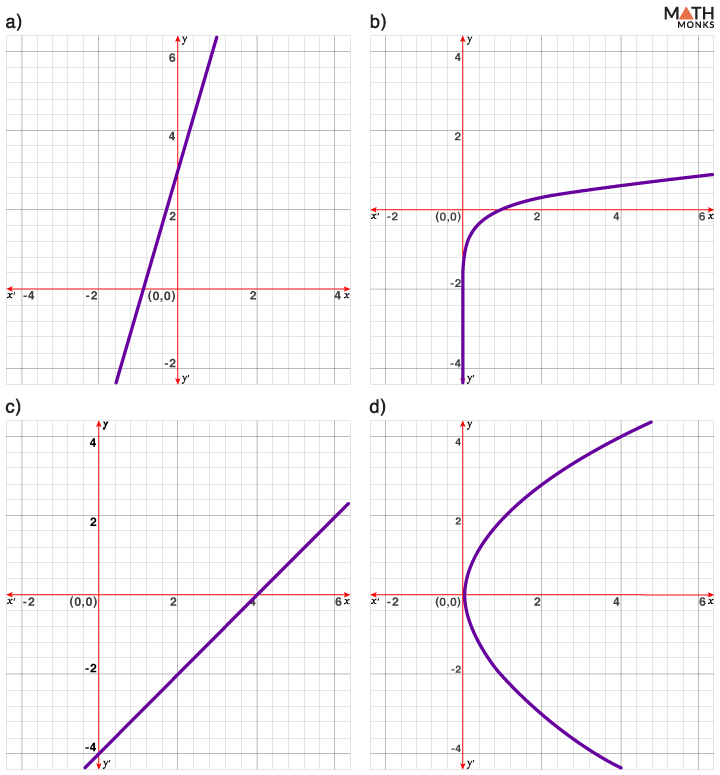
Which is the graph of a logarithmic function?
Solution:
Here, option b) is the graph of a logarithmic function.


 Which is the graph of a logarithmic function?