Semi-log graphs and log-log graphs are two different types of logarithmic graphs used for plotting statistical data with a wide range in magnitudes.
Semi-log Graph
In a semi-log (or semi-logarithmic) graph, the y-axis is scaled logarithmically (the scales between the ticks on the graph are proportional to the logarithm of numbers), while the x-axis remains linear (the scales are evenly placed), making this graph a hybrid of the two scales.
However, semi-log graphs can also be represented with the logarithmic x-axis and the linear y-axis.
Interpretation
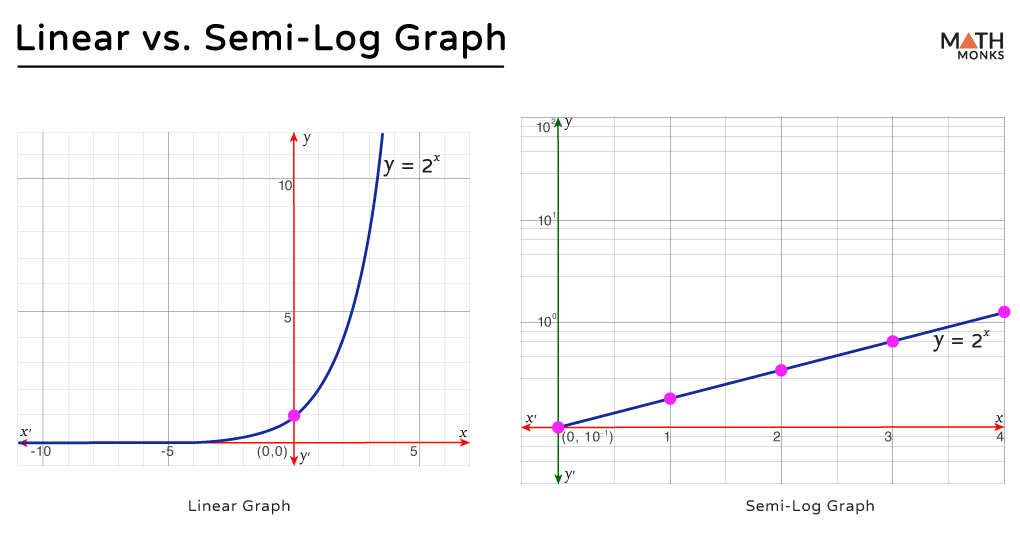
Now, plotting a function y = 2x on a linear scale as well as on a semi-log scale, we get:
Selecting some points of the x-variables and evaluating the values of the function, we get
x
0
1
2
3
4
5
y = 2x
20 = 1
21 = 2
22 = 4
23 = 8
24 = 16
25 = 32
Now, using the values, we get the graphs as follows:
Observation
Since the y-axis of the semilog graph contains only the logarithms of positive numbers, the negative numbers are not included in this graph.
It is useful for graphing exponential functions like y = abx, which produces a straight line with the slope of log(b) and the y-intercept of log(a).
Given is a blank printable version of the above Semi Log Graph for your use.
Log-log Graph
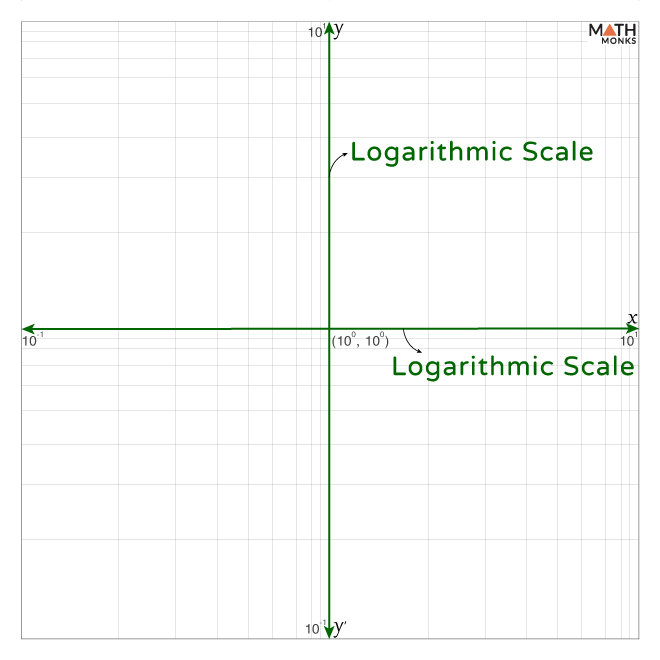
In a log-log (or double logarithmic) graph, both the x and y-axes use a logarithmic scale.
It is used to create population charts, Zipf distributions, and air pressure measurements.
Interpretation
Now, plotting a function y = x3 on an ordinary axis (where the x and y axes are linear) as well as on a log-log scale, we get:
Selecting some points of the x-variables and evaluating the values of the function, we get
x
1
2
3
4
5
10
y = x3
13 = 1
23 = 8
33 = 27
43 = 64
53 = 125
103 = 1000
Now, using the values, we get the graphs as shown:
Observation
It is useful for determining power relationships between variables expressed in exponential form like y = axb, which produces a straight line with the slope ‘b’ and the y-intercept of log(a).
Given is a blank printable version of the above Log Log Graph for your use.
Solved Examples
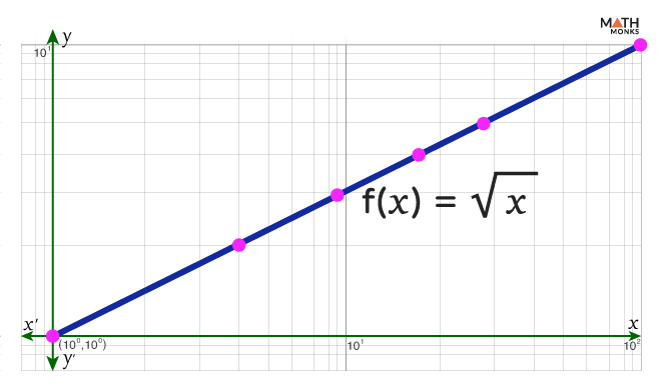
E.g.1. Plot f(x) = ${\sqrt{x}}$ on a log-log graph.
Here, f(x) = ${\sqrt{x}}$
Selecting some points of the x-variables and evaluating the values of the function f(x), we get
x
1
4
9
16
25
100
f(x)
1
2
3
4
5
10
Now, using the values, we get the following log-log graph.
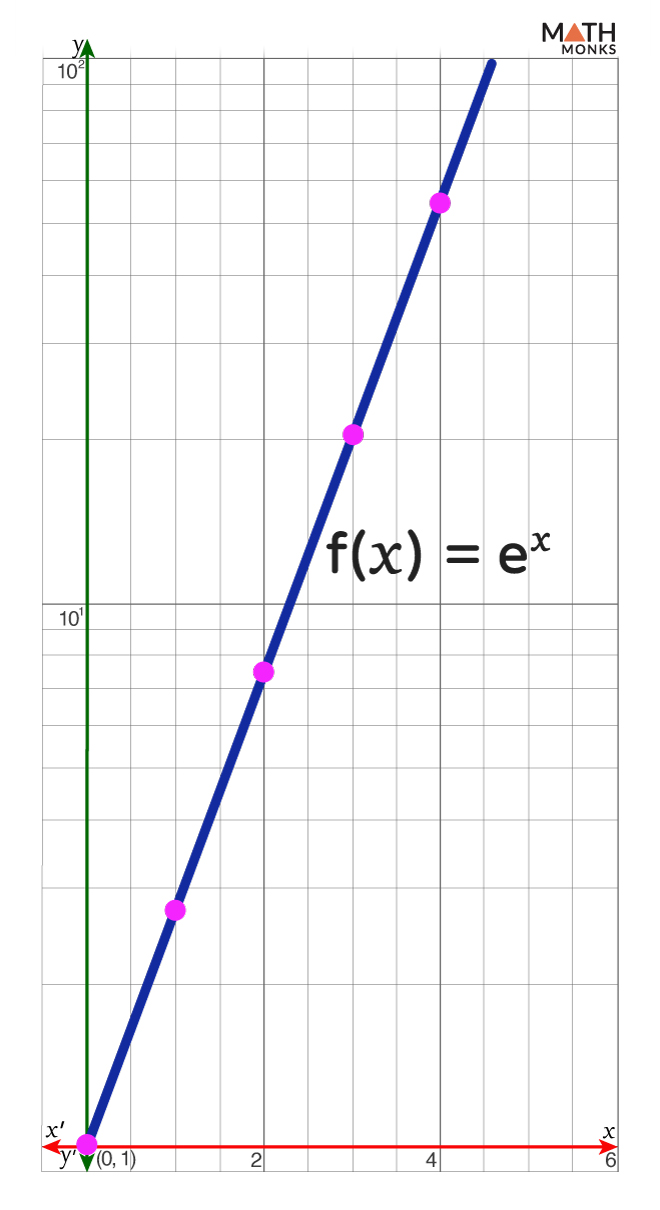
E.g.2. Plot f(x) = ex on a semi-log graph.
Here, f(x) = ex
Selecting some points of the x-variables and evaluating the values of the function f(x), we get
x
0
1
2
3
4
f(x)
1
2.72
7.39
20.1
54.6
Now, using the values, we get the following semi-log graph.