Linear polynomials are those polynomials that have a degree of 1, which means the highest exponent of the variable x in the expression is 1.
Formula
A linear polynomial in standard form is expressed as:
f(x) = ax + b
Here,
a and b are real numbers, and a ≠ 0
Note: If a = 0, then f(x) = b, which is a constant polynomial.
Here are a few examples of linear polynomials:
- g(x) = 5x + 7
- h(x) = πx + √3
- k(x) = -x + y – 9
Finding Roots (Zeros)
To find the root of a linear polynomial, we can equate the polynomial to 0 and solve for the variable.
Let us consider the linear polynomial p(x) = 3x + 6
Equating the Polynomial Function to 0
3x + 6 = 0
Isolating the Variable x
⇒ 3x = -6
⇒ x = ${\dfrac{-6}{3}}$
⇒ x = -2
Thus, x = -2 is the solution of p(x) = 3x + 6
In general, for a linear polynomial ax + b, the formula to determine the root is:
x = ${\dfrac{-b}{a}}$
Graphing
When plotted on a graph, a linear polynomial represents a straight line.
In the general form ax + b,
- The coefficient of x (i.e., a) represents the slope of the line, indicating its steepness.
- The constant term (i.e., b) denotes the y-intercept, where the line crosses the y-axis.
These two values determine the position of the line and its orientation on the graph.
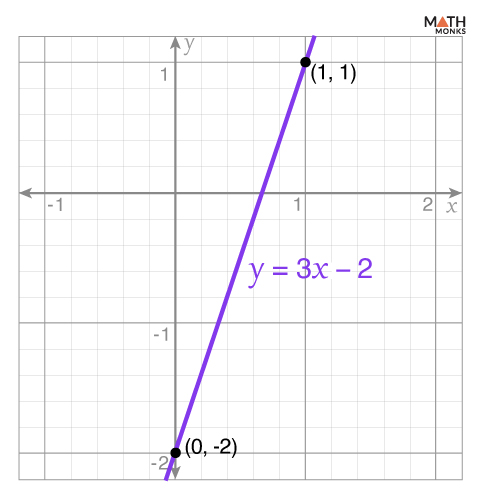
Let us graph the polynomial y = 3x – 2
Here,
- Slope: a = 3
- Y-intercept: b = -2
Now, using these values, we will follow the following steps to create the graph.
Finding the Y-Intercept
The y-intercept is the value of y when x = 0. Here, the y-intercept is b = -2
Thus, the coordinates of the y-intercept are (0, -2)
Using the Slope to Find Another Point
The slope of this line is a = 3 or a = ${\dfrac{3}{1}}$, which indicates moving 1 unit to the right (positive x-direction) and 3 units up (positive y-direction).
Starting from the y-intercept (0, -2):
- Moving up 3 units (from y = -2 to y = 1)
- Moving right 1 unit (from x = 0 to x = 1)
Thus, the coordinates of the translated point are (1, 1)
Sketching the Line
Now that we have two points, (0, -2) and (1, 1), we can draw a straight line through them.
Joining these two points with a line and then extending the line in both directions, we get
Here, the line represents y = 3x – 2
To double-check the accuracy of the line, we can substitute other values of x into the equation to get additional points for graphing.
Solved Examples
![]() Determine if each of the following expressions is a linear polynomial. If it is, find the slope and y-intercept.
Determine if each of the following expressions is a linear polynomial. If it is, find the slope and y-intercept.
a) y = 4x + 7
b) y = -3x
c) y = x2 + 2
d) y = 2x – 5
e) y = 5
Solution:
![]()
a) Given, y = 4x + 7 …..(i)
As we know, the standard form of the linear polynomial is y = ax + b (a ≠ 0) …..(ii)
Comparing (i) and (ii), we get
a = 4 and b = 7
Thus, it is a linear polynomial.
The slope is a = 4
The y-intercept is b = 7
b) Given, y = -3x …..(i)
As we know, the standard form of the linear polynomial is y = ax + b (a ≠ 0) …..(ii)
Comparing (i) and (ii), we get
a = -3 and b = 0
Thus, it is a linear polynomial.
The slope is a = -3
The y-intercept is b = 0
c) Given, y = x2 + 2 …..(i)
As we know, the standard form of the linear polynomial is y = ax + b (a ≠ 0) …..(ii)
Here,
The degree of equation (i) is 2, whereas the degree of equation (ii) is 1
Thus, it is not a linear polynomial.
d) Given, y = 2x – 5 …..(i)
As we know, the standard form of the linear polynomial is y = ax + b (a ≠ 0) …..(ii)
Comparing (i) and (ii), we get
a = 2 and b = -5
Thus, it is a linear polynomial.
The slope is a = 2
The y-intercept is b = -5
e) Given, y = 5 …..(i)
As we know, the standard form of the linear polynomial is y = ax + b (a ≠ 0) …..(ii)
Here,
The leading coefficient a = 0 in equation (i)
Thus, it is not a linear polynomial.
![]() Given the linear polynomial y = 2x – 3, calculate the value of y when
Given the linear polynomial y = 2x – 3, calculate the value of y when
a) x = 0
b) x = 2
c) x = -1
Solution:
![]()
Given, y = 2x – 3 …..(i)
a) Here, x = 0
Substituting the value x in equation (i),
y = 2(0) – 3
⇒ y = -3
b) Here, x = 2
Substituting the value x in equation (i),
y = 2(2) – 3
⇒ y = 4 – 3
⇒ y = 1
c) Here, x = -1
Substituting the value x in equation (i),
y = 2(-1) – 3
⇒ y = -2 – 3
⇒ y = -5
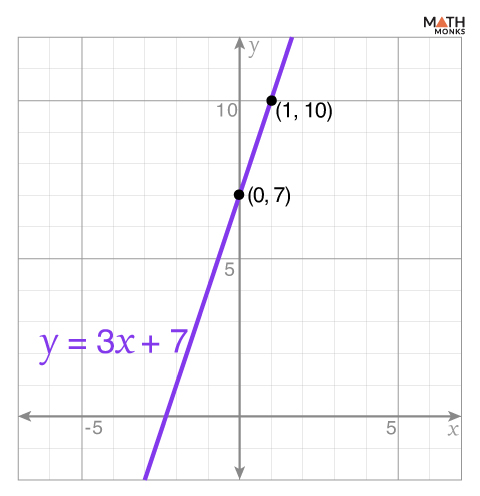
![]() Graph the linear polynomial y = 3x + 7
Graph the linear polynomial y = 3x + 7
Solution:

Given, y = 3x + 7 …..(i)
As we know, the standard form of the linear polynomial is y = ax + b (a ≠ 0) …..(ii)
Comparing the equations (i) and (ii), we get
a = 3 and b = 7
Thus, the slope is a = 3 and the y-intercept is b = 7
The coordinates of the y-intercept are (0, 7)
a = ${\dfrac{3}{1}}$, indicating that for every 1 unit, we move to the right (positive x-direction), we move up 3 units (positive y-direction).
Now, when the starting point is (0, 7):
Moving up 3 units (from y = 7 to y = 10)
Moving right 1 unit (from x = 0 to x = 1)
Thus, the coordinates of another point are (1, 10)
After plotting the points (0, 7) and (1, 10) and extending the line in both directions, we get the required graph.


