Graphing a polynomial function helps us to identify its properties, including the zeros, turning points, and end behavior. It also gives us the shape of the function. For example, odd-degree polynomials exhibit opposite end behaviors, while even-degree polynomials have ends that rise or fall together.
It is used to model population growth, solve algebraic equations visually, and analyze trends statistically.
Plotting a polynomial function involves the following steps.
- Finding the Degree and Leading Coefficient
- Finding the Zeros
- Plotting the Y-Intercept
- Determining Turning Points
- Identifying the Concavity and Inflection Point
- Sketching the Graph
Steps
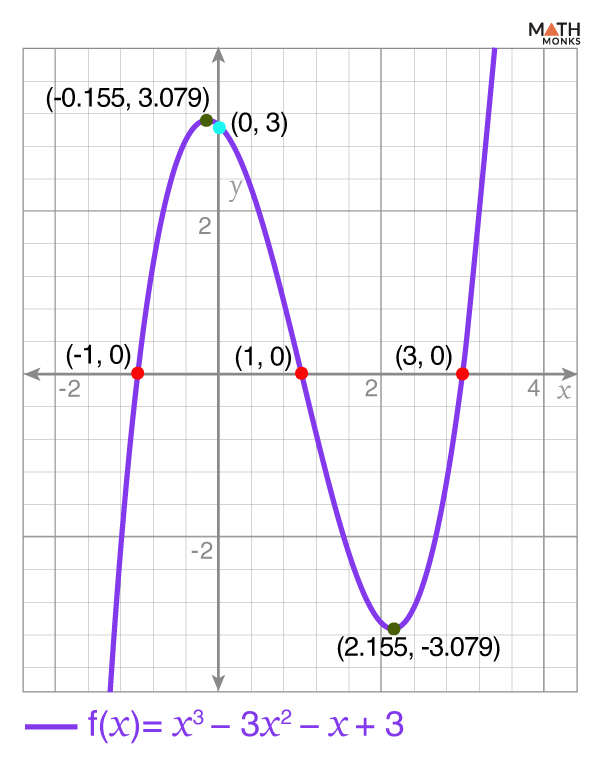
Let us graph the function f(x) = x3 – 3x2 – x + 3
Finding the Degree and Leading Coefficient
Identifying the degree of the polynomial and the leading coefficient helps us to predict the graph’s general shape and end behavior.
Here, the degree of f(x) is 3, an odd number.
Thus, f(x) is an odd-degree polynomial, indicating the graph falls to the left and rises to the right.
Also, the leading coefficient is 1 (positive), which means the end behavior is:
- As x → ∞, f(x) → ∞
- As x → -∞, f(x) → -∞
Finding the Zeros
Solving for f(x) = 0 gives us the roots or zeros (x-intercepts).
Here,
x3 – 3x2 – x + 3 = 0
x2(x – 3) – (x – 3) = 0
(x – 3)(x2 – 1) = 0
(x – 3)(x + 1)(x – 1) = 0
(x – 3)(x + 1)(x – 1) = 0 gives
x = 3, 1, and -1
Thus, the graph crosses the x-axis at (3, 0), (1, 0), and (-1, 0)
Plotting the Y-Intercept
It shows where the graph crosses the y-axis.
By substituting x = 0, we get
f(0) = (0)3 – 3(0)2 – (0) + 3
⇒ f(0) = 3
Thus, the graph crosses the y-axis at (0, 3)
Determining the Turning Points
It shows where the graph changes its direction.
Calculating the first derivative,
f’(x) = 3x2 – 6x – 1
Now, setting f’(x) = 0, we get
3x2 – 6x – 1 = 0
Using the quadratic formula,
x = ${\dfrac{-\left( -6\right) \pm \sqrt{\left( -6\right) ^{2}-4\times 3\times \left( -1\right) }}{2\times 3}}$
⇒ x = ${\dfrac{6\pm \sqrt{36+12}}{6}}$
⇒ x = ${\dfrac{6\pm \sqrt{48}}{6}}$
⇒ x = ${\dfrac{6\pm 4\sqrt{3}}{6}}$
⇒ x = ${1\pm \dfrac{2\sqrt{3}}{3}}$
Thus, the critical points are at x = ${1\pm \dfrac{2\sqrt{3}}{3}}$
Now, for x = ${1+\dfrac{2\sqrt{3}}{3}}$ ≈ 2.155, we have
f(x) ≈ -3.079
Now, for x = ${1-\dfrac{2\sqrt{3}}{3}}$ ≈ -0.155, we have
f(x) ≈ 3.079
Thus, the critical points are (2.155, -3.079) and (-0.155, 3.079)
Identifying the Concavity and Inflection Point
Concavity describes whether a graph curves upward or downward, while inflection points indicate where the graph changes concavity – from curving upward (concave up) to curving downward (concave down) or vice versa.
The second derivative is
f”(x) = 6x – 6
Now, setting f”(x) = 0, we get
6x – 6 = 0
⇒ 6x = 6
⇒ x = 1
At x = 1, f(x) = 0
Thus, the inflection point is at (1, 0)
Sketching the Graph
Here,
We have
Zeros: (-1, 0), (1, 0), and (3, 0)
Y-Intercept: (0, 3)
Critical Points: (2.155, -3.079) and (-0.155, 3.079)
Inflection Point: (1, 0)
End Behavior:
- As x → ∞, f(x) → ∞
- As x → -∞, f(x) → -∞
After plotting all these points, we get
Solved Examples
![]() Graph the cubic polynomial function: f(x) = -2x3 + 6x2 – 4x
Graph the cubic polynomial function: f(x) = -2x3 + 6x2 – 4x
Solution:
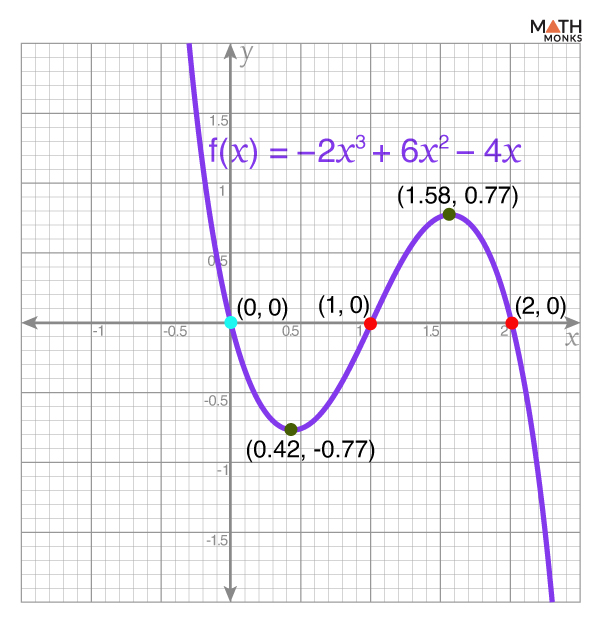
Given, f(x) = -2x3 + 6x2 – 4x
Finding Degree and Leading Coefficient
Since the degree is 3 (odd), and the leading coefficient is -2 (positive), then
As x → ∞, f(x) → -∞
As x → -∞, f(x) → ∞
Finding Zeros
Now, f(x) = -2x3 + 6x2 – 4x
⇒ f(x) = -2x(x2 – 3x + 2)
⇒ f(x) = -2x(x2 – 2x – x + 2)
⇒ f(x) = -2x[x(x – 2) – 1(x – 2)]
⇒ f(x) = -2x(x – 2)(x – 1)
Now, putting f(x) = 0 ⇒ -2x(x – 2)(x – 1) = 0 gives
x = 0, 1, and 2
Thus, the x-intercepts are at (0, 0), (1, 0), and (2, 0)
Finding the Y-Intercept
By substituting x = 0, we get
f(0) = -2(0)3 + 6(0)2 – 4(0)
⇒ f(0) = 0
Thus, the y-intercept is at (0, 0)
Determining Turning Points
The first derivative is
f’(x) = -6x2 + 12x – 4
-6x2 + 12x – 4 = 0
⇒ 3x2 – 6x + 2 = 0
⇒ x = ${\dfrac{-\left( -6\right) \pm \sqrt{\left( -6\right) ^{2}-4\times 3\times 2}}{2\times 3}}$
⇒ x = ${\dfrac{6\pm \sqrt{36-24}}{6}}$
⇒ x = ${\dfrac{6\pm \sqrt{12}}{6}}$
⇒ x = ${\dfrac{6\pm 2\sqrt{3}}{6}}$
⇒ x = ${1\pm \dfrac{\sqrt{3}}{3}}$
Since ${1+\dfrac{\sqrt{3}}{3}}$ ≈ 1.58 and ${1-\dfrac{\sqrt{3}}{3}}$ ≈ 0.42
At x = 1.58, f(x) = 0.77
At x = 0.42, f(x) = -0.77
Thus, the critical points are at (1.58, 0.77) and (0.42, -0.77)
Identifying the Concavity and Inflection Point
The second derivative is
f”(x) = -12x + 12
-12x + 12 = 0
⇒ 12x = 12
⇒ x = 1
Thus, the inflection point is (1, 0)
After plotting these points, we get the required graph.
Problem: Graphing QUADRATIC POLYNOMIAL FUNCTIONS
![]() Graph f(x) = -x2 + 4x – 3
Graph f(x) = -x2 + 4x – 3
Solution:
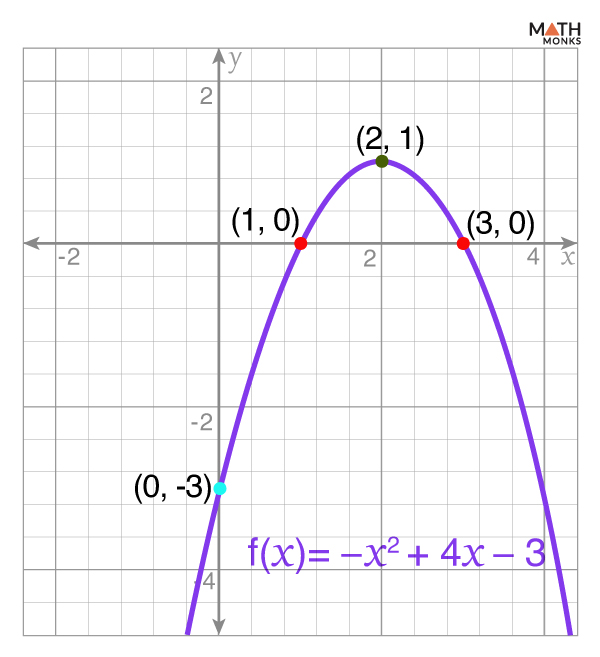
Given, f(x) = -x2 + 4x – 3
Finding the Degree and Leading Coefficient
Here, f(x) is a quadratic function in the standard form:
f(x) = ax2 + bx + c
a = -1, b = 4, and c = -3
Thus, the degree is 2 (even), and the leading coefficient is -1 (negative).
End behavior:
As x → ∞, f(x) → -∞
As x → -∞, f(x) → -∞
Finding the Roots (Zeros)
Setting f(x) = 0, we get
-x2 + 4x – 3 = 0
⇒ x2 – 4x + 3 = 0
⇒ x2 – 3x – x + 3 = 0
⇒ x(x – 3) – 1 (x – 3) = 0
⇒ (x – 3)(x – 1) = 0
⇒ x = 3 and 1
Thus, the x-intercepts are at (1, 0) and (3, 0)
Finding the Y-Intercept
When x = 0,
f(0) = -(0)2 + 4(0) – 3
⇒ f(0) = -3
Thus, the y-intercept is at (0, -3)
Finding the Vertex
The formula for the x-coordinate of the vertex is:
${x=-\dfrac{b}{2a}}$
Substituting a = -1 and b = 4,
${x=-\dfrac{4}{2\left( -1\right) }}$
⇒ x = 2
At x = 2, f(x) = -(2)2 + 4(2) – 3 = 1
Thus, the vertex is at (2, 1)
After plotting these points, we get the required graph.
Problem: Graphing QUARTIC POLYNOMIAL FUNCTIONS
![]() Graph: f(x) = x4 – 4x2
Graph: f(x) = x4 – 4x2
Solution:
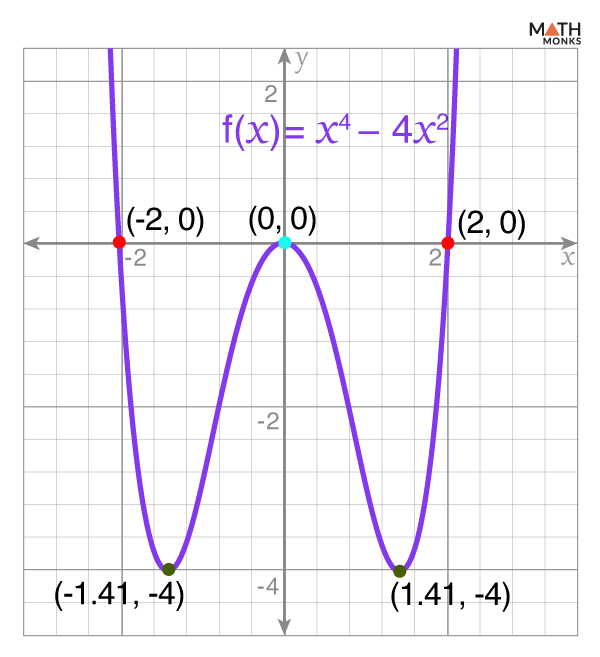
Here, we follow the same steps, such as graphing cubic polynomial functions.
Given, f(x) = x4 – 4x2
Finding the Degree and the Leading Coefficient
Since the degree is 4 (even), and the leading coefficient is 1 (positive), then
As x → ∞, f(x) → ∞
As x → -∞, f(x) → ∞
Finding Zeros
Now, f(x) = x4 – 4x2
⇒ f(x) = x2(x2 – 4)
⇒ f(x) = x2(x + 2)(x – 2)
Now, putting f(x) = 0 ⇒ x2(x + 2)(x – 2) = 0 gives
x = 0, -2, and 2
Thus, the x-intercepts are at (-2, 0), (0, 0), and (2, 0)
Finding the Y-Intercept
By substituting x = 0, we get
f(0) = (0)4 – 4(0)2
⇒ f(0) = 0
Thus, the y-intercept is at (0, 0)
Determining Turning Points
Now, the first derivative is f’(x) = 4x3 – 8x
4x3 – 8x = 0
⇒ 4x(x2 – 2) = 0
⇒ x = 0, ${\sqrt{2}}$, and ${-\sqrt{2}}$
At x = 0, f(x) = 0
At x = ${\sqrt{2}}$, f(x) = -4
At x = ${-\sqrt{2}}$, f(x) = -4
Since ${\sqrt{2}}$ ≈ 1.41 and ${-\sqrt{2}}$ ≈ -1.41
Thus, the critical points are (0, 0), (1.41, -4), and (-1.41, -4)
Identifying the Concavity and Inflection Point
The second derivative is f”(x) = 12x2 – 8
12x2 – 8 = 0
⇒ 12x2 = 8
⇒ x2 = ${\dfrac{2}{3}}$
⇒ x = ${\pm \sqrt{\dfrac{2}{3}}}$ ≈ ±0.82
At x = ±0.82, f(x) = -2.22
Thus, inflection points are at (0.82, -2.22) and (-0.82, -2.22)
After plotting all these points, we get the required graph.
Problem: Finding the POLYNOMIAL FUNCTION when its GRAPH is given
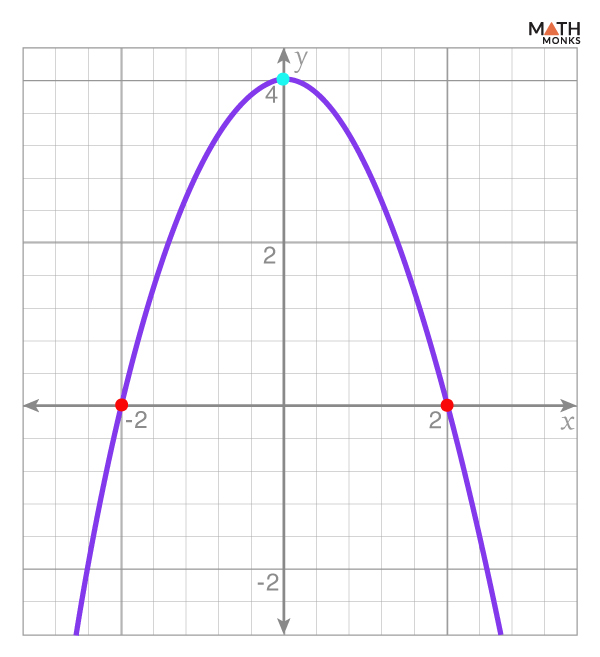 Determine the polynomial function for the graph.
Solution:
![]()
Here, from the graph provided:
Shape of the graph: The graph is a parabola, which suggests it is a degree-2 polynomial function, i.e., a quadratic function.
Vertex: The highest point (vertex) of the parabola is at (0, 4)
Roots (x-intercepts): The graph crosses the x-axis at (-2, 0) and (2, 0)
As we know, the vertex form of a quadratic function is: y = a(x – h)2 + k …..(i)
Here, (h, k) is the vertex
Substituting the vertex (0,4) in the formula (i), we get
y = a(x – 0)2 + 4
⇒ y = ax2 + 4 …..(ii)
Now, substituting one of the roots (2, 0) in the equation (ii), we get
0 = a(2)2 + 4
⇒ 0 = 4a + 4
⇒ 4a = -4
⇒ a = -1
Substituting the value a = -1 in the equation (ii), we get
y = -x2 + 4
Thus, the equation of the polynomial function is y = -x2 + 4
 Which polynomial function corresponds to the graph below?
a) f(x) = x2 – 6x + 8
b) g(x) = 3x2 – 18x + 24
c) h(x) = x2 + 6x + 8
d) k(x) = 3x2 + 18x + 24
Solution:
![]()
Here,
The graph is a parabola that opens upward, indicating the leading coefficient (i.e., a) is positive.
The vertex is at (h, k) = (-3, -1)
The x-intercepts are (-4, 0) and (-2, 0)
The y-intercept is at (0, 10)
As we know, the parabola represents a quadratic polynomial function, and its standard form is:
y = a(x – h)2 + k …..(i)
Here, substituting the vertex in the equation (i), we get
y = a[x – (-3)]2 + (-1)
⇒ y = a(x + 3)2 – 1 …..(ii)
Now, substituting one of the roots (-2, 0) in the equation (ii), we get
0 = a(-2 + 3)2 – 1
⇒ a – 1 = 0
⇒ a = 1
Thus, the equation (i) becomes
y = 1(x + 3)2 – 1
⇒ y = x2 + 6x + 9 – 1
⇒ y = x2 + 6x + 8, which is option c.
Thus, option c) represents the given graph.
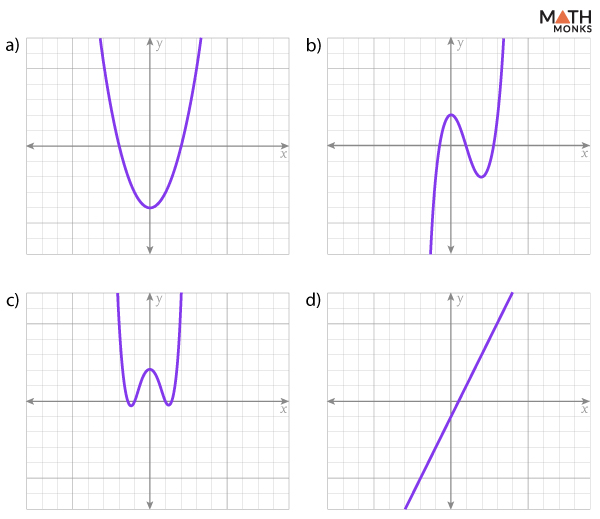 Which graph below represents an even-degree polynomial function, and which one represents an odd-degree polynomial function?
Solution:
![]()
Since even-degree polynomial graphs:
1. Have symmetrical ends (either both ends point up or both point down).
2. It can have zero, two, or more turning points.
3. The number of x-intercepts varies but is never odd.
Since odd-degree polynomial graphs:
1. Have ends pointing in opposite directions (one end up, the other down).
2. They pass through the origin if the constant term is zero.
Thus,
Option a) and c) represent even-degree polynomial functions.
Option b) and d) represent odd-degree polynomial functions.



 Determine the polynomial function for the graph.
 Which polynomial function corresponds to the graph below?
 Which graph below represents an even-degree polynomial function, and which one represents an odd-degree polynomial function?