Graphing fractions on a number line helps us represent and compare fractions, like plotting whole numbers and integers. Fractions represent a part of a whole.
For representing a fraction on a number line, its two immediate whole numbers are marked at both ends. The total distance is divided into a total number of equal parts according to the value of the denominator. The numerator represents its distance from 0.
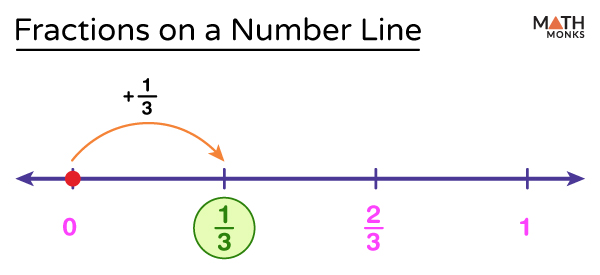
For example, in the fraction ${\dfrac{1}{3}}$, the numerator is 1, and the denominator is 3.
As we know that 0 < ${\dfrac{1}{3}}$ < 1, to put ${\dfrac{1}{3}}$ on a number line, we divide the region from 0 to 1 into 3 equal parts as the denominator is 3. Then, we move towards the right, starting from 0 based on the value of the numerator (here, 1). So we mark the 1st part starting from 0 as ${\dfrac{1}{3}}$.
Fractions on a Number Line 0 1
Here, ${\dfrac{1}{3}}$ is a unit fraction as it has 1 as its numerator.
As a number line represents values in ascending order, the values of the fractions also increase from left to right, like ${\dfrac{1}{3}}$ < ${\dfrac{2}{3}}$
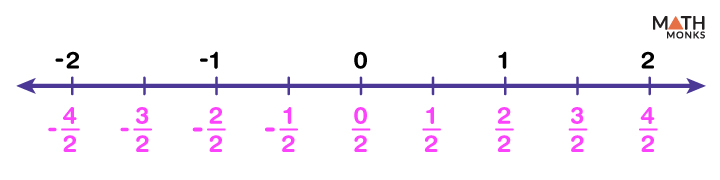
As we know, while representing fractions on a number line, it appears between two integers. Thus, positive fractions lie at the right of 0 and between two positive integers, while the negative ones lie at the left of 0 and between two negative integers on a number line.
Number Line Positive and Negative Fractions
The above figure divides the region between each pair of successive integers into two equal parts. The positive fractions ${\dfrac{1}{2}}$, ${\dfrac{3}{2}}$ are found to the right of 0, while the negative fractions ${-\dfrac{1}{2}}$, ${-\dfrac{3}{2}}$ lie to the left of 0.
Representing Fractions on a Number Line
We can represent different types of fractions on a number line.
Proper Fractions
We can plot positive and negative proper fractions easily on a number line. As a proper fraction has its numerator always less than the denominator (comparing only the numeric values of the numerator and the denominator), a positive proper fraction always lies between 0 and 1 on a number line. Similarly, a negative proper fraction lies between (-1) and 0.
In the first diagram, we have shown plotting a positive proper fraction.
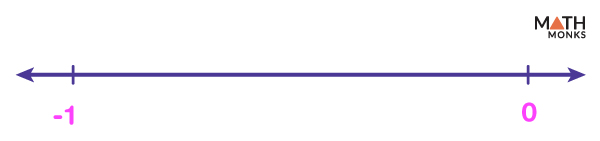
Similarly, we can represent a negative proper fraction on a number line by marking the points (-1) and 0 and dividing the region into equal parts based on the denominator. Then we move from right to left, starting from 0 according to the numerator.
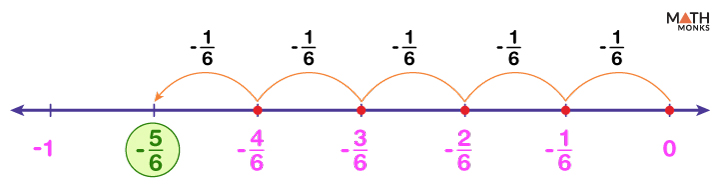
For example, to show ${-\dfrac{5}{6}}$ on a number line, we mark the points (-1) and 0 on a number line.
Number Line Negative Proper Fraction Step 1
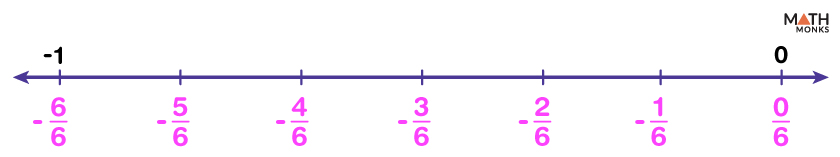
Then we divide the region from (-1) to 0 into 6 equal parts as the denominator is 6. Each part represents ${-\dfrac{1}{6}}$.
Number Line Negative Proper Fraction Step 2
Next, we move from right to left starting from 0 up to the 5th part as the numerator is 5 and mark it as ${-\dfrac{5}{6}}$
Number Line Negative Proper Fraction Step 3
Equivalent Fractions
Equivalent fractions are located at the same point on a number line because they represent the same value when it is reduced to its simplest form despite having different denominators and numerators.
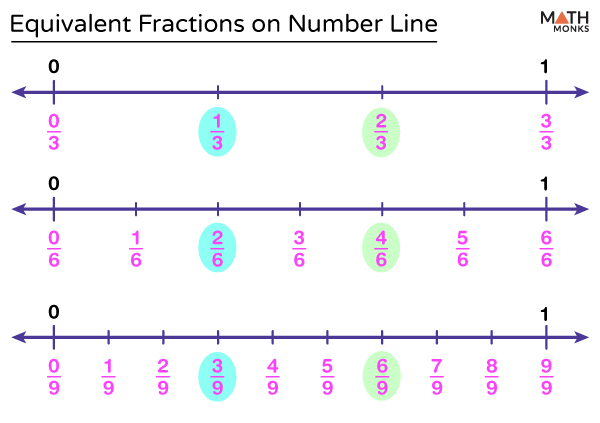
Let us represent the equivalent fractions ${\dfrac{1}{3}}$, ${\dfrac{2}{6}}$, ${\dfrac{3}{9}}$ on a number line:
To plot ${\dfrac{1}{3}}$, we divide the region from 0 to 1 into 3 equal parts and mark the first part as ${\dfrac{1}{3}}$
To plot${\dfrac{2}{6}}$, we divide the region from 0 to 1 into 6 equal parts and mark the second part as ${\dfrac{2}{6}}$
Similarly to plot ${\dfrac{3}{9}}$ , we divide the region from 0 to 1 into 9 equal parts and mark the third part as ${\dfrac{3}{9}}$
Equivalent Fractions on a Number Line
Mixed Fractions
To represent a mixed fraction on a number line, we first identify its integer and proper fraction parts separately. Next, we mark those two integers on the number line between which the mixed fraction lies and move the number of steps right or left according to the proper fraction part.
Let us represent the mixed fraction ${4\dfrac{2}{5}}$ on the number line.
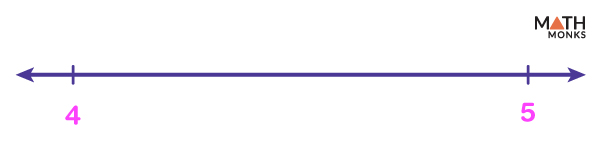
We get the fraction ${4\dfrac{2}{5}}$ by adding its integer part 4 and the proper fraction part ${\dfrac{2}{5}}$. To represent ${4\dfrac{2}{5}}$ on a number line, we first mark 4 and 5 on the number line as the integer part is 4 and ${4\dfrac{2}{5}}$ lies between 4 and 5.
Number Line Mixed Fraction Step 1
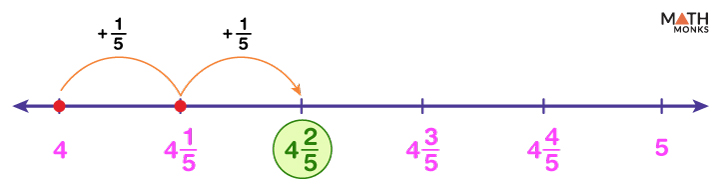
Next, we divide the above line segment into 5 equal parts, each representing ${\dfrac{1}{5}}$ and go to the proper fractional part (here${\dfrac{2}{5}}$) starting from 4.
Number Line Mixed Fraction Step 2
Thus we find the point representing ${4\dfrac{2}{5}}$ on the number line.
Improper Fractions
Representing improper fractions (positive and negative) on a number line is similar to graphing proper fractions. Positive improper fractions are always greater than 1 and lie between 1 and a positive integer. Similarly, negative improper fractions being less than (-1), lie between (-1) and a negative integer.
We can represent improper fractions on a number line by converting them into a mixed fraction and following the same procedure as above.
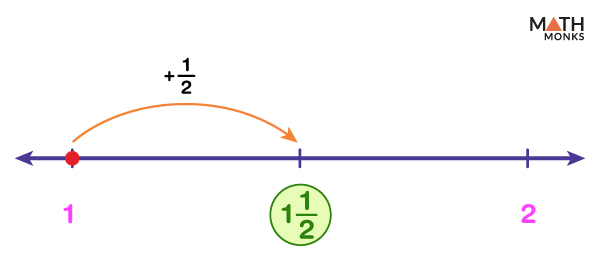
For example, to plot ${\dfrac{3}{2}}$ on a number line, we first convert it into a mixed fraction
${\dfrac{3}{2}}$ = ${1\dfrac{1}{2}}$
Then, we mark 1 and 2 on the number line as the integer part is 1. As we know, ${\dfrac{3}{2}}$ lies between 1 and 2; we divide the region from 1 to 2 into two equal parts, each representing ${\dfrac{1}{2}}$ and move towards the proper fraction, here ${\dfrac{1}{2}}$.
Fraction on a Number Line
Thus we find ${\dfrac{3}{2}}$ on a number line.
Solved Examples
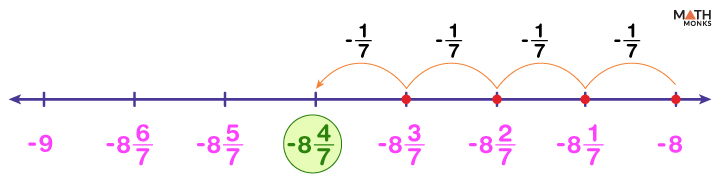
Represent the fraction ${-8\dfrac{4}{7}}$ on the number line.
Solution:
To represent ${-8\dfrac{4}{7}}$ on the number line, we follow the given steps: In the fraction ${-8\dfrac{4}{7}}$, the integer part is (-8) and the proper fraction part is ${-\dfrac{4}{7}}$. As ${-8\dfrac{4}{7}}$ lies between the integers (-8) and (-9), we divide the region from (-8) to (-9) in 7 equal parts and mark the 4th part starting from (-8). Thus we get ${-8\dfrac{4}{7}}$ on the number line.
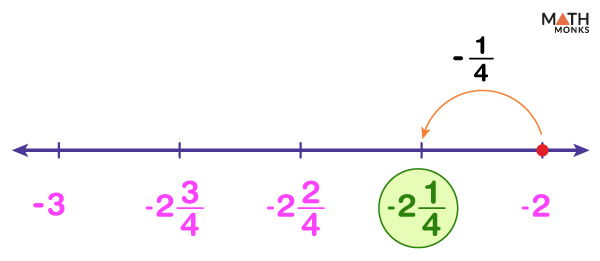
Locate ${-\dfrac{9}{4}}$ on a number line.
Solution:
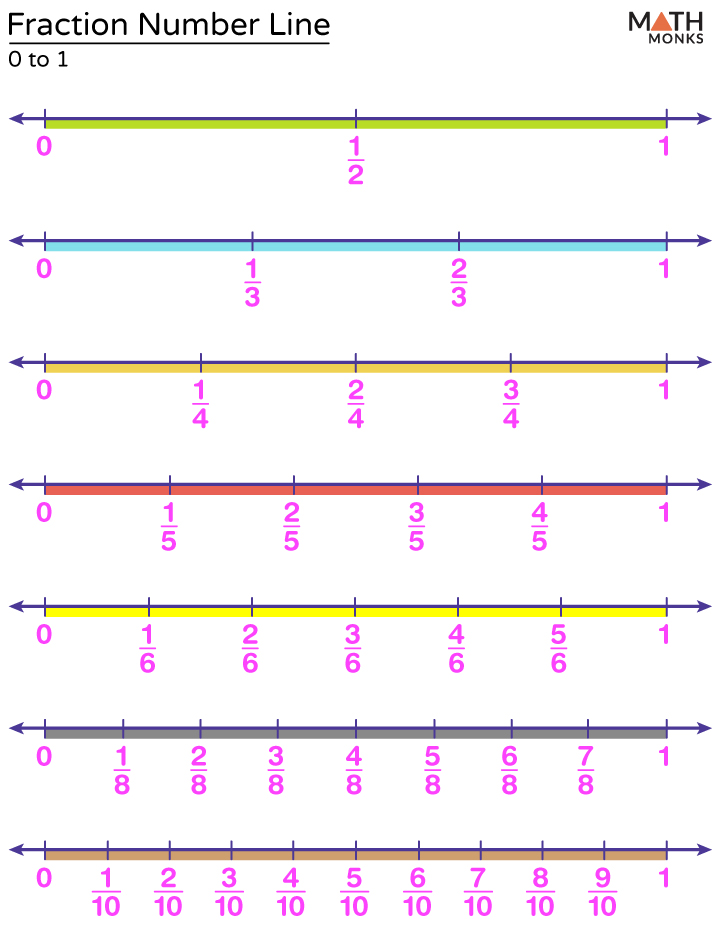
We first convert the improper fraction ${-\dfrac{9}{4}}$ into a mixed fraction. Again, ${-\dfrac{9}{4}}$ = ${-2\dfrac{1}{4}}$ Since ${-2\dfrac{1}{4}}$ lies between (-2) and (-3). Next we divide the region from (-2) to (-3) into 4 equal parts each representing ${-\left( \dfrac{1}{4}\right)}$ and go to the 1st part starting from (-2) to get the answer. Thus we find ${-\dfrac{9}{4}}$ on the number line. We have provided a printable fraction number line chart from 0 to 1 for your use.
We have provided a printable fraction number line chart from 0 to 1 for your use.