Compound inequalities is a mathematical statement that combines two linear inequalities with AND or OR. Thus graphing a compound inequality involves two cases:
For a value to satisfy a compound inequality including AND, the value satisfies both inequalities. Thus, the solution set of such inequality is the intersection (∩) of both inequalities.
For a value to satisfy a compound inequality involving OR, it only satisfies either of the two inequalities or both. The solution set of such inequality is the union (∪) of both inequalities.
In both cases, the solutions can be expressed as graphs on the number line and interval notations.
Compound Inequalities with AND
As the inequality including ‘AND’ denotes the intersection of both inequalities, we graph each inequality separately and then consider the final result involving both.
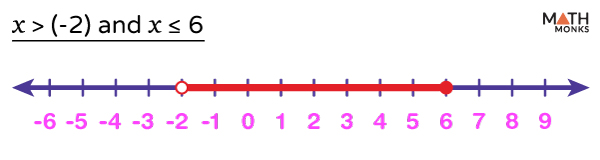
Let us graph the compound inequality x > (-2) and x ≤ 6.
The given inequality represents all such values of x that are greater than (-2) and less than or equal to 6. These values lie between (-2) and 6, including 6 and excluding (-2).
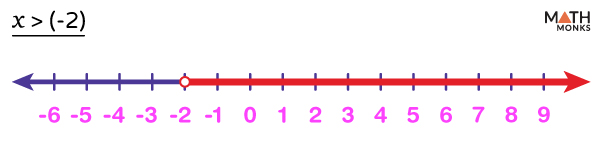
Step 1: The solution region of x > (-2) is highlighted to the right of (-2) with the arrow going towards positive infinity (∞) on the number line. The circle on (-2) is open, as the solution does not include (-2).
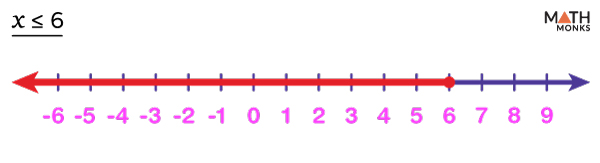
Step 2: Next, we draw x ≤ 6 on another number line and show the solution region to the left of 6, highlighting with an arrow that extends towards negative infinity (-∞). The circle on 6 is closed as the solution includes 6.
Step 3: On combining both results, the solution region is found to satisfy both inequalities.
Graphing Compound Inequalities on a Number Line
So for an inequality involving ‘AND’, the number line only includes those numbers that satisfy both inequalities.
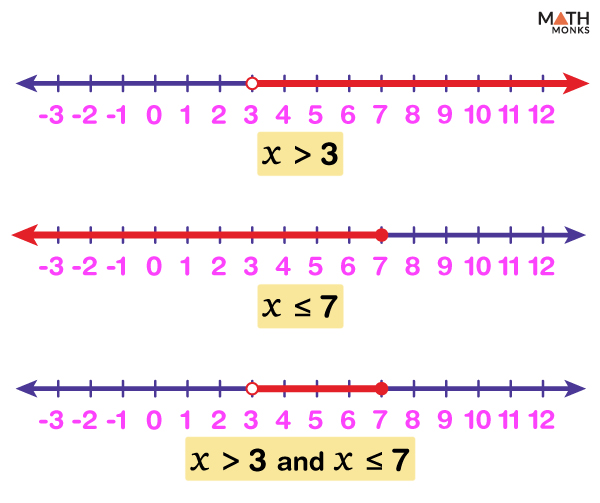
Solve the compound inequality 2x – 5 > 1 and 3x + 9 ≤ 30graph the solution on a number line.
Solution:
We first solve and graph each linear equality separately to solve the above compound inequality. First inequality: 2x – 5 > 1 Adding 5 on both sides gives: 2x > 6 Dividing both sides by 2 gives: x > 3 All the possible values satisfying the above inequality are highlighted to the right of 3, excluding 3, with an arrow going towards infinity (∞). Second inequality: 3x + 9 ≤ 30 Subtracting 9 from both sides gives: 3x ≤ 21 Dividing both sides by 3 gives: x ≤ 7 The solution graph to the above inequality is highlighted to the left of 7, including 7, with an arrow extending towards negative infinity (-∞). Combining the above two graphs, we get the compound inequality solution graph, where x lies between 3 and 7, 3 is excluded, and 7 is included.
Compound Inequalities with OR
Because the graph of a compound inequality involving OR is the union of two inequalities, we can graph the two inequalities on the same number line to get our final graph.
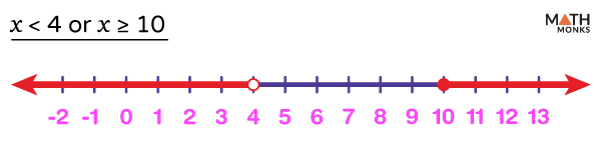
Let us graph the compound inequality x < 4 or x ≥ 10.
Step 1: The solution graph of x < 4 is highlighted to the left of 4, excluding 4, with an arrow going to minus infinity (-∞). The circle on 4 is open as the solution does not include 4.
Step 2: Similarly, the values satisfying x ≥ 10 to the right of 10, including 10, are highlighted using another arrow continuing forever to the right. The circle on 10 is closed, as the solution includes 10.
Step 3: The number line is shown:
Graph Compound Inequalities on a Number Line
So for an inequality containing ‘OR’, the arrows will point in two different directions, and the graphs will never intersect.
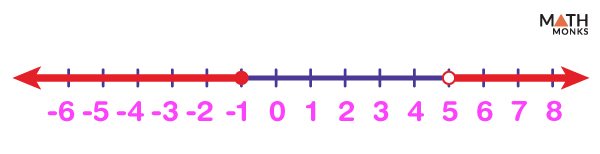
Find the type of compound inequality graphed on the number line.
Solution:
In the above diagram, the open circle at point 5 means that 5 is excluded from the solution. The arrow to the right of 5 shows the region of all values greater than 5. Now, we write the inequality in terms of the variable x as x > 5 Similarly, the closed circle at the point (-1) indicates that (-1) is included in the solution, and an arrow is drawn to the left of (-1) to mark the region of all values less than or equals to (-1). The inequality is written as x ≤ (-1) using the same variable. As the graphs of both the linear inequalities never intersect and the arrows point in two different directions, the compound inequality involves ‘OR’. So the inequality given by the graph is x > 5 or x ≤ (-1)
 Find the type of compound inequality graphed on the number line.