Like we plot real numbers, we can also graph inequalities on a number line. It helps us find and represent the entire region covered by inequality.
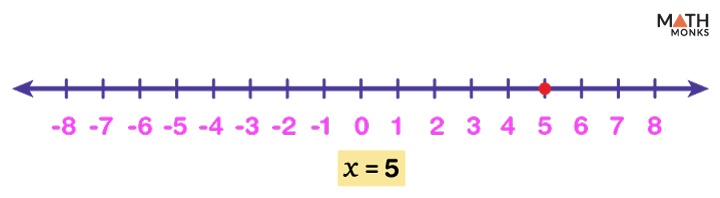
While plotting equality, for example, x = 5, we draw a circle over the number (here, 5) on the number line.
While graphing an inequality, we follow the same initial steps. However, since inequality has a <, >, ≤, or ≥ in it, here we highlight the entire range of numbers that is true.
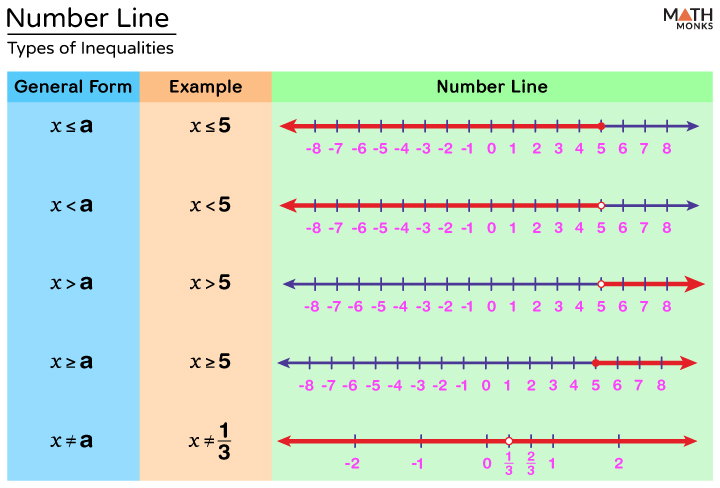
The different forms of inequalities are shown with examples:
Graphing Inequalities on a Number Line
For Inequalities x ≤ a
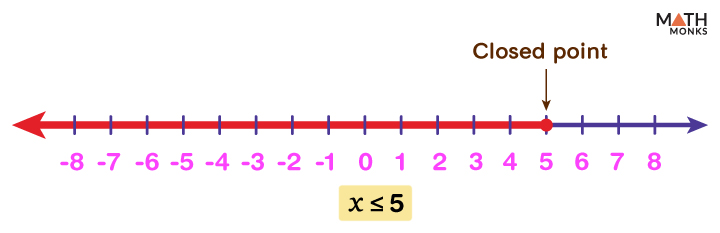
The solution to the inequality x ≤ a includes ‘a’ and all the values below ‘a’.
Let us graph the inequality, x ≤ 5, on the number line. The solution to this inequality is represented as {….-5, -4, -3, -2, -1, 0, 1, 2, 3, 4, 5}. It includes all the numbers starting from 5 till -∞ as shown. The solution also includes other real numbers (decimal or fraction form) whose values fall within the range of the inequality.
The arrow to the left of 5 shows all the solutions of x. The circle on 5 is filled as it is included in the solution. Such a circle is called a closed circle.
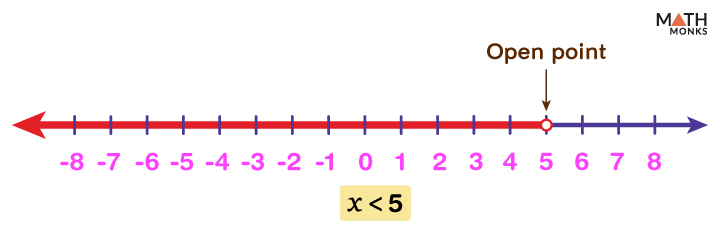
For Inequalities x < a
However, if we graph the inequality x < 5, the circle over 5 is unfilled. It means it includes all numbers below 5, excluding 5. Here, the circle is an open circle.
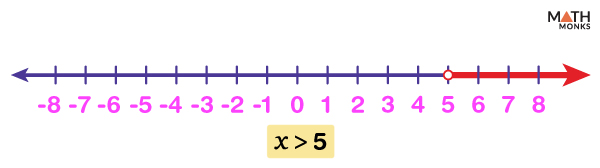
For Inequalities x > a
The graph of x > 5 represents all possible values of x greater than 5, excluding 5. So we put an open circle on 5.
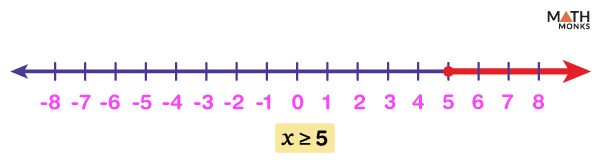
For Inequalities x ≥ a
In contrast, graphing x ≥ 5 represents all the real values greater than 5, including 5. Thus, we put a closed circle on 5.
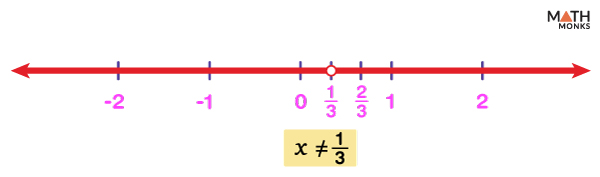
For Inequalities x ≠ a
An inequality of the form x ≠ a on a number line includes the solution set of all the real numbers except the point ‘a’.
For example, x ≠ ${\dfrac{1}{3}}$ represents all the possible solutions of x except ${\dfrac{1}{3}}$. So we graph the entire number line removing the point ${\dfrac{1}{3}}$.
The solution region is shown with arrows to both sides of ${\dfrac{1}{3}}$ just removing that point.
Solving Inequalities Using a Number Line
A number line helps us to solve an inequality by changing the inequality sign into an equal sign and solving the equation. Though inequalities can be manipulated like equations, the sign becomes reversed when both sides of an inequality are multiplied or divided by a negative number.
For example, to solve the inequality -2(x – 10) ≥ 18, we first divide both sides of the inequality by (-2) and get:
(x – 10) ≤ (-9)
Next, we add 10 to both sides:
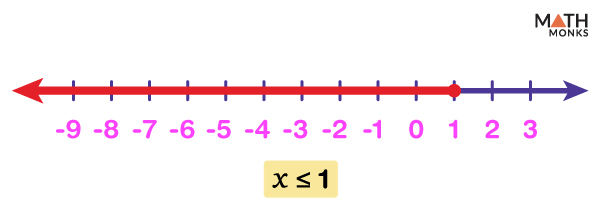
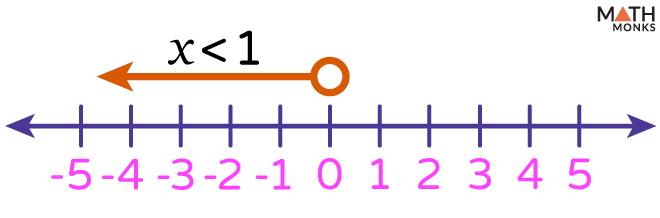
x ≤ 1
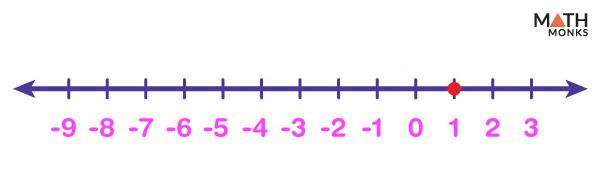
Now let us divide the number line into two regions, one to the left and the other to the right of 1, and mark point 1 as a closed circle.
Then, we choose random points from each side of 1 and observe if they satisfy the inequality for the chosen value.
Considering a point on the left of 1, say (-1), then
-2(-1 – 10) = 22 > 18
But if we choose a point to the right of 1, say 3, then -2(3 – 10) = 14 < 18.
It proves that the original inequality holds for any value of x ≤ 1
Thus the solution region for the inequality -2(x – 10) ≥ 18 is obtained by graphing the inequality x ≤ 1 on the number line and using an arrow to the left of 1.
Solved Examples
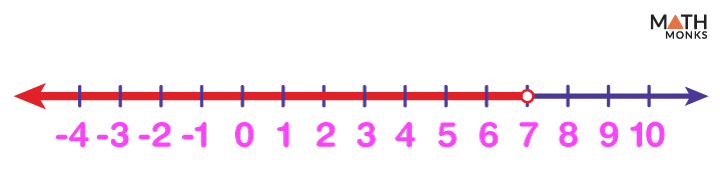
Identify the inequality graphed on the number line.
Solution:
There is an open circle at point 7 and an arrow to show all the regions less than 7. Now, if we choose a variable for which we are finding the solution, say x, then the region left of 7 shows all the possible values of x such that x < 7 Thus, the inequality corresponding to the given graph is x < 7.
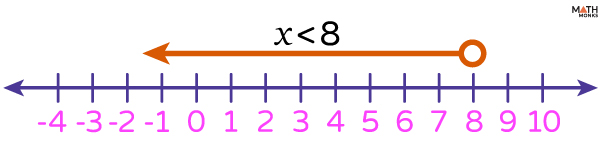
Graph the inequality x < 8 on the number line.
Solution:
Here, x < 8 represents ‘x is less than 8,’ which is graphed as shown, and the open circle denotes that 8 is not a solution.
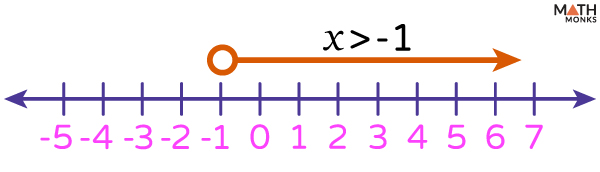
Graph the inequality x > -1 on the number line.
Solution:
Here, x> -1 represents ‘x is greater than -1,’ whose graph is plotted, and the open circle denotes that -1 is not a solution.
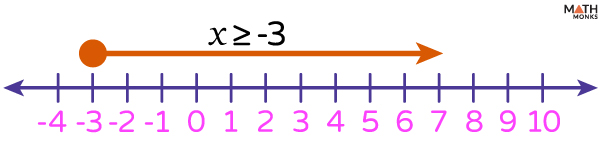
Graph the inequality x ≥ -3
Solution:
Here, x ≥ -3 represents ‘x is greater than or equal to -3,’ thus, the value -3 is included. The closed circle denotes that -3 is also a solution.
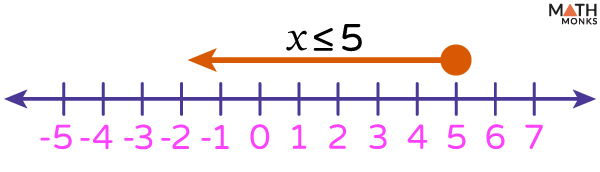
Plot the graph of the inequality x ≤ 5
Solution:
Here, x ≤ 5 represents ‘x is less than or equal to 5,’ thus, the value 5 is included. The closed circle denotes that 5 is also a solution.
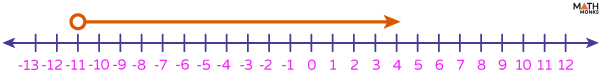
Find the inequality shown on the number line.
Solution:
Here, we can observe that the ray starts from -11, and the open circle means -11 is excluded from the solution set. The line represents all the values greater than -11. Thus, for the variable ‘x,’ the inequality is x > -11
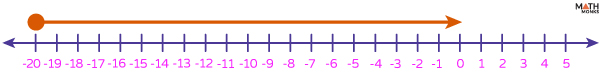
Find the inequality shown on the number line.
Solution:
Here, the ray starts from -20, and the closed circle shows that -20 is included in the solution set. The line represents all the values greater than -20 (included). Thus, for any variable ‘x,’ the inequality is x ≥ -20
Graph the inequality 2x + 3 < 5 on the number line.
Solution:
Here, 2x + 3 < 5 ⇒ 2x < 5 – 3 (by subtraction property) ⇒ 2x < 2 ⇒ x < 1 (by division property) Thus, 2x + 3 < 5 is equivalent to x < 1 whose graph is: