We can graph any quadratic equation using a graphing tool. Still, we need to make the graph manually to understand the logic behind its making.
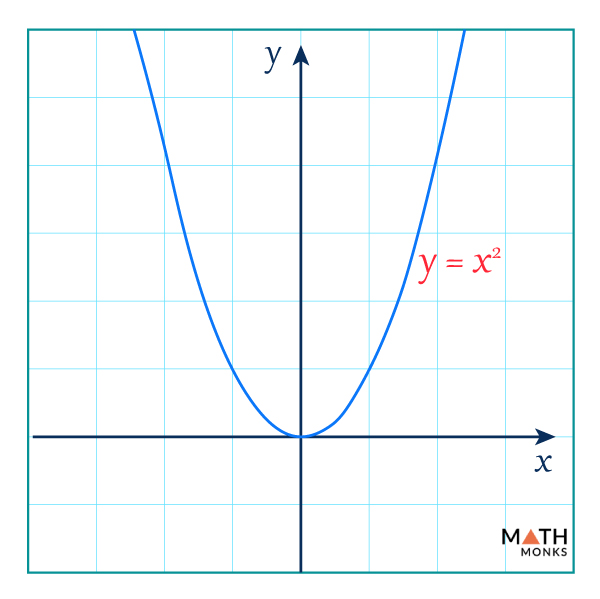
Let us consider the simplest quadratic function f(x) = x2. Graphing this on a coordinate plane will give us the shape shown below.
Graphing Quadratic Equations Figure 1
Let us consider the most straightforward quadratic function f(x) = x2. Graphing this on a coordinate plane will give us the shape shown below.
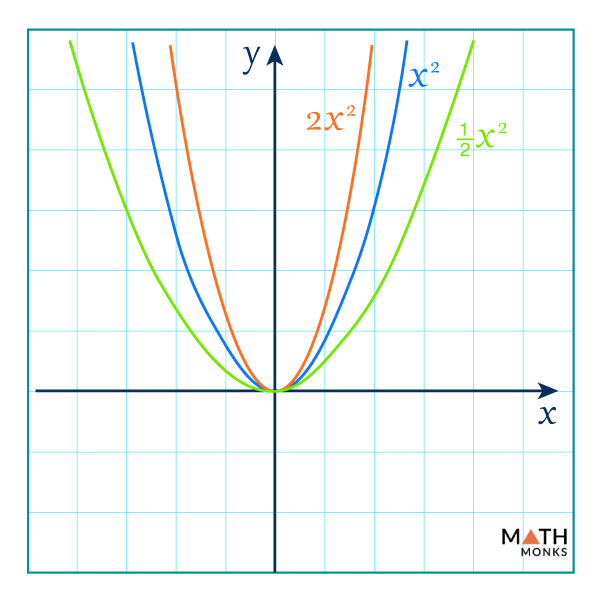
Graphing Quadratic Equations Figure 2
Graphing Quadratic Equations Figure 3
When the value of ‘a’ is positive, the curve is U-shaped facing upwards
When the value of ‘a’ is negative, the curve is inverted U-shaped, facing downwards
When the value of ‘a’ increases, the curve squeezes inwards
When the value of ‘a’ decreases, the curve bulge outwards
From Standard and Vertex Form
We prefer to graph quadratic equations when it is given in vertex form f(x) = a(x – h)2 + k, where (h, k) is the vertex and h = ${h=\dfrac{-b}{2a}}$, k = f(h). However, the quadratic equation is often represented in the standard form ax2 + bx + c = 0, which first needs to be converted to the vertex using the steps shown here.
The most important reason we use the vertex form is that the vertex, the lowest or the highest form of the graph, can be easily obtained. Also, since the graph is symmetrical about the axis x = h, it makes it easy to plot the graph.
Graphing Quadratic Equations Figure 4
Thus, from the graph, the ‘h’ shows us how far left or right the curve has shifted from x = 0. Similarly, ‘k’ shows how far up or down the curve has been shifted from y = 0.
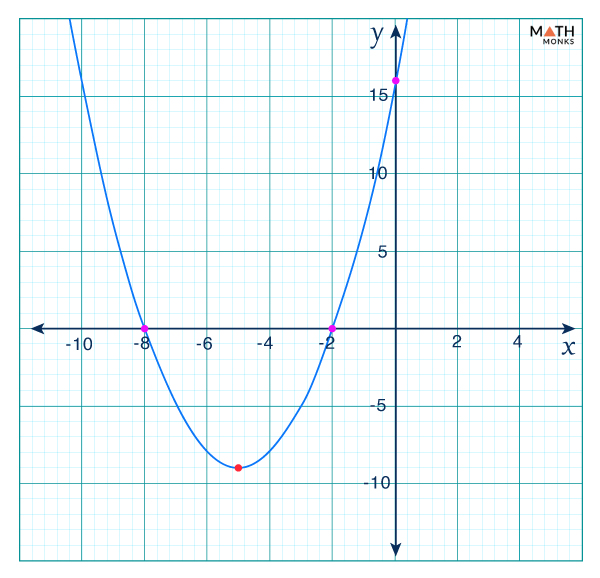
Let us graph the quadratic function f(x) = x2 + 10x + 16 = 0. Comparing the given function with the quadratic function in the standard form f(x) = ax2 + bx + c, we get
a = 1, b = 10, c = 16
From the above values, we can say:
The graph will be U-shaped facing upwards
As the coefficient of x is 2, which is small, the graph will be a little squeezed than the x2 graph
Let us first calculate the vertex (h, k)
h = ${h=\dfrac{-b}{2a}}$ = ${\dfrac{-10}{2\times 1}}$= -5
k = f(-5) = (-5)2 + 10 × (-5) + 16 = -9
Thus, the vertex is at (-5, -9). We can now plot the graph manually.
Graphing Quadratic Graph 1
How to Find a Quadratic Equation from a Graph
It is the reverse way of what we have seen above. We can also solve quadratic equations given the graph corresponding to it.
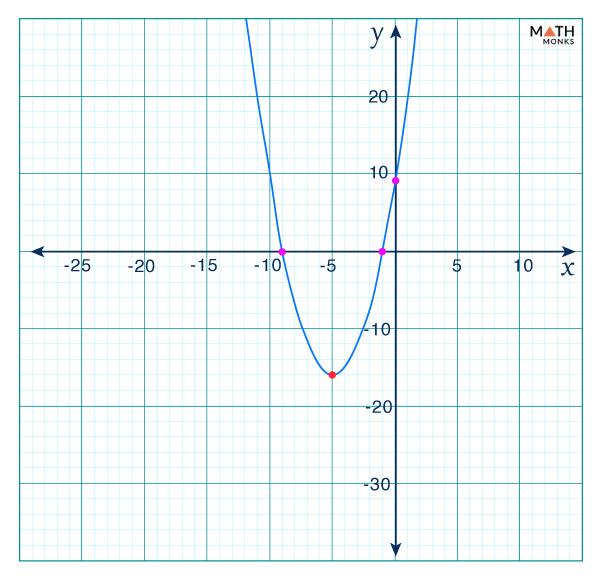
Suppose we need to write the quadratic equation corresponding to the given graph.
Graphing Quadratic Graph 2
From the graph, we can find the vertex as (-5, -16)
Substituting the value of the vertex in the vertex form of the quadratic equation, we get
f(x) = a(x – h)2 + k, here h = -5, k = -16
= a(x + 5)2 – 16
As the given parabola is also found to pass through the point (-1, 0) so
f(-1) = 0 …(1)
Again,
a(x + 5)2 – 16 at x = -1 is f(-1) = a(-1 + 5)2 – 16 …(2)